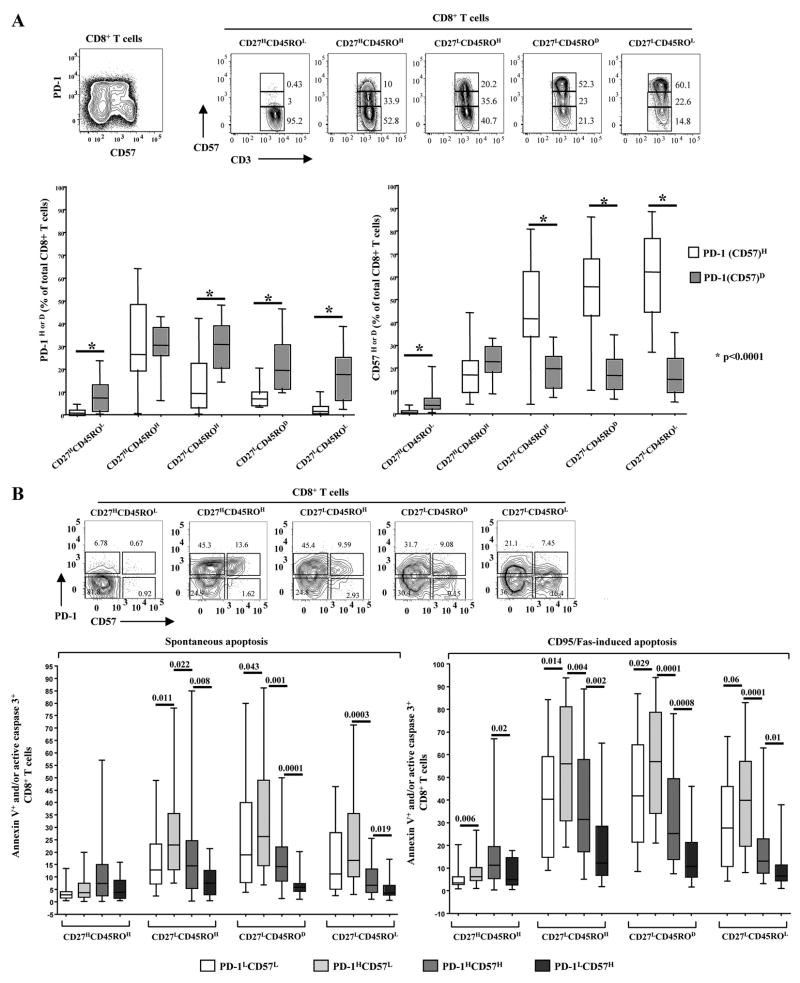
FIGURE 3.
Differential association of PD-1 and CD57 with ex vivo spontaneous and CD95/Fas-induced apoptosis of CD8+ T cells from HIV infected donors. A, Representative flow cytometry plots showing the expression of PD-1 vs CD57 (upper left) as well as the expression of CD57 in memory CD8+ T cell populations (upper right). Pooled data showing the relative expression of PD-1 and CD57 in relation to maturation status of CD8+ T cells from HIV+ donors (n = 26) are shown in the lower panels. Bars depict median values. p values were calculated using the Mann-Whitney U test. B, Representative plots showing the expression of PD-1 in relation to CD57 one in naive and memory CD8+ T cell populations (upper panel). Pooled data showing the percentage (%) of apoptotic memory CD8+ T cells from HIV+ donors (n = 28) with respect to PD-1 and CD57 expression are shown in the lower panels. Bars depict median values. p values were calculated using Mann-Whitney U test.

