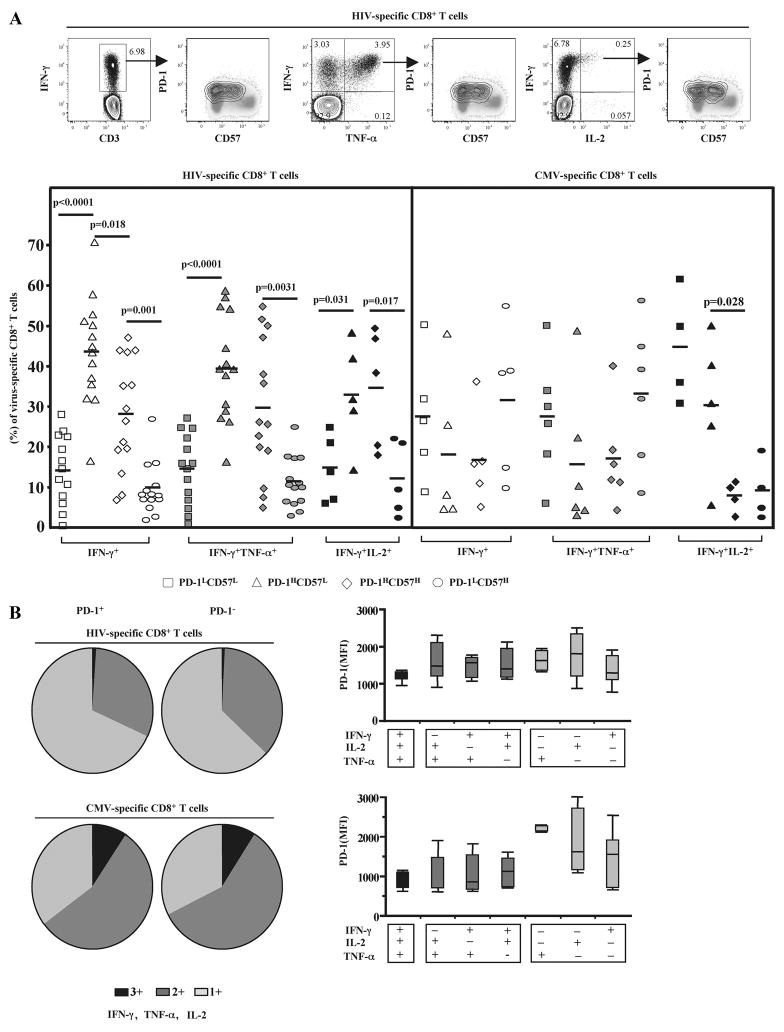
FIGURE 4.
HIV-specific CD8+ T cells express predominantly a PD-1HCD57L phenotype that is not associated with their ex vivo ability to produce cytokines. A, Representative flow cytometry plots depicting the expression of PD-1 and CD57 in Gag-specific CD8+ T cells identified by IFN-γ+, IFN-γ+TNF-α+, or IFN-γ+IL-2+ cytokine production (upper panel). Pooled data showing the phenotype of HIV- and CMV-specific CD8+ T cells with respect to expression of PD-1 and CD57 (lower panel). Bars depict median values. p values were calculated using Mann-Whitney U test. B, Functional composition of the HIV- (n = 8) and CMV-specific (n = 8) CD8+ T cell responses in relation to PD-1 expression. Each slice of the pie represents the fraction of the total response that consists of CD8+ T cells positive for a given number of functions (left panel). MFI values of PD-1 for every possible combination of responses are shown on the x-axis (right panel). Boxes represent interquartile ranges; mean and SD lines are shown.

