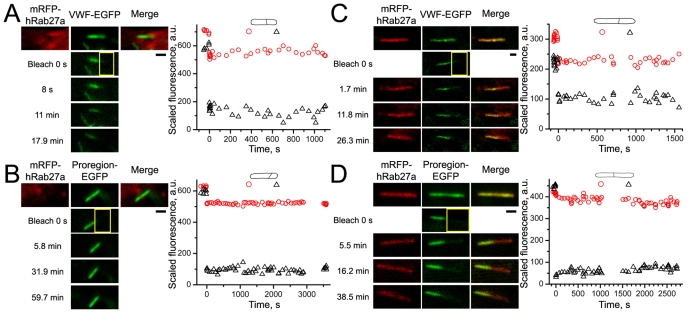
Fig. 2.
VWF–EGFP and Proregion–EGFP are immobile in immature and mature WPBs. Leftmost panels in each image series show the absence or presence of mRFP–Rab27a in WPB membranes allowing identification of immature (A,B) or mature (C,D) WPBs, respectively. The middle panels show, from top to bottom, a control image, an image of the bleaching frame at t=0 seconds (bleaching ROI is indicated in yellow here and in all subsequent figures) and three postbleach images at the times indicated to the left of images. Rightmost panels in series show mRFP–Rab27a and EGFP–core protein fluorescences superimposed. All scale bars in this and subsequent figures are 1 μm. The graphs here and below show the time courses of average fluorescence, after scaling according to the Eqn 3, recorded in split ROIs (shown schematically above the graphs). Red circles and black triangles indicate the fluorescence in nominally unbleached and bleached ROIs, respectively. a.u., arbitrary units.

