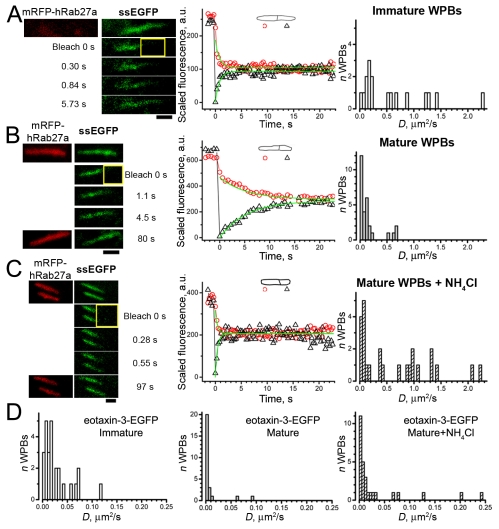
Fig. 3.
Formation and maturation of WPBs leads to a progressive decrease in intra-WPB mobility of ssEGFP and eotaxin-3–EGFP, that is reversed in mature WPBs by acute exposure to NH4Cl. FRAP of (A) ssEGFP in an immature mRFP–Rab27a-negative WPB, (B) a mature mRFP–Rab27a-positive WPB in a control cell and (C) during acute exposure to 40 mM NH4Cl. (A-C) Left: top images show prebleach images of mRFP–Rab27a fluorescence (left; red) and ssEGFP fluorescence (right; green) in cells coexpressing both constructs; the remaining images show ssEGFP fluorescence in the bleach frame (bleach 0 seconds) and in selected postbleach frames at the times indicated. (B,C) Lower left, images of mRFP–Rab27a fluorescence at the end of the experiment. Middle panels in A-C show plots of the recovery of scaled fluorescence. Smooth lines are fits using the ‘corona’ diffusion model. For the examples shown, D values were 1.2 μm2/second (A), D=0.11 μm2/second (B) and D=1.0 μm2/second (C). In C the plot is presented for the bottom WPB in the left panel; for the top WPB the value of D was 0.98 μm2/second. The right panels in A-C show histograms of D values for ssEGFP, ordinates indicate the number of WPBs, bin width 0.05 μm2/second. (D) Histograms of D values for eotaxin-3–EGFP obtained in immature WPBs, mature WPBs and mature WPBs exposed to NH4Cl, as indicated. Bin width is 0.005 μm2/second.

