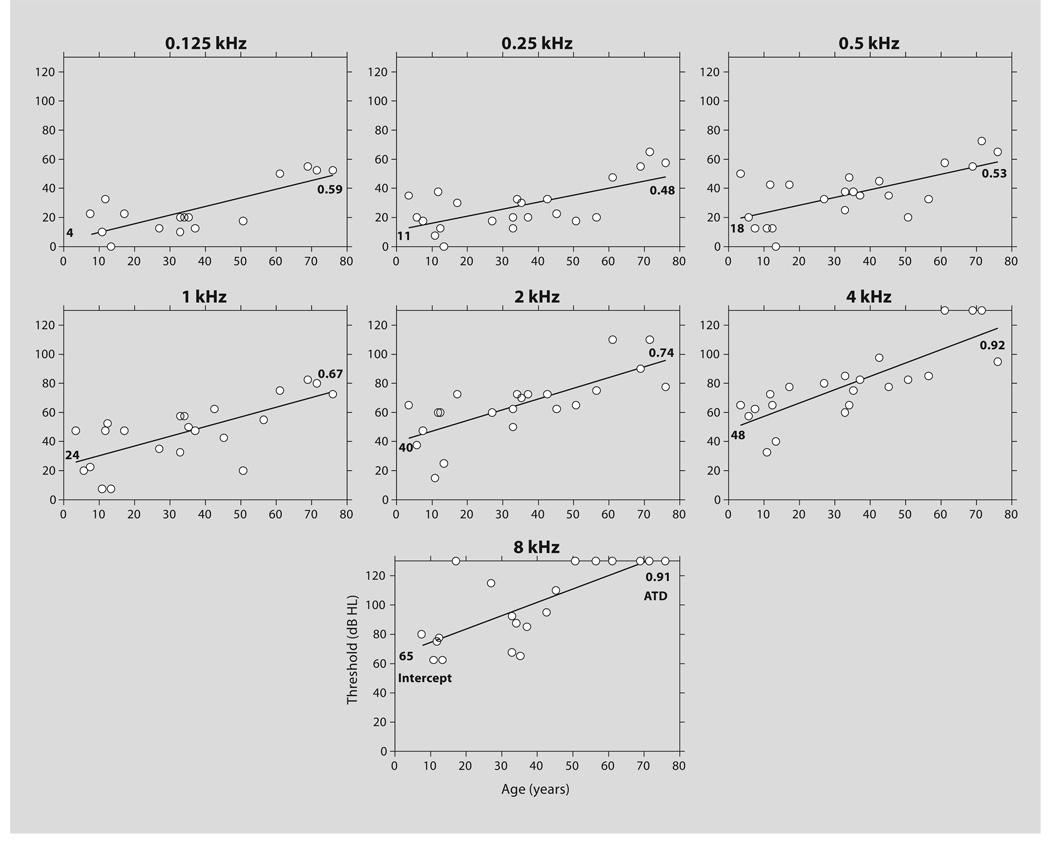
Fig. 3.
Cross-sectional analysis of binaural mean air conduction threshold (dB HL) on age (in years) at the frequencies 0.125–8 kHz for which more than 10 measurements were available. Each frequency panel includes the regression line with a bold figure on the right end indicating the ATD (dB/year) and a bold figure on the left end indicating the Y-intercept (dB). All slopes and the Y-intercepts of >4 dB are significantly different from zero.

