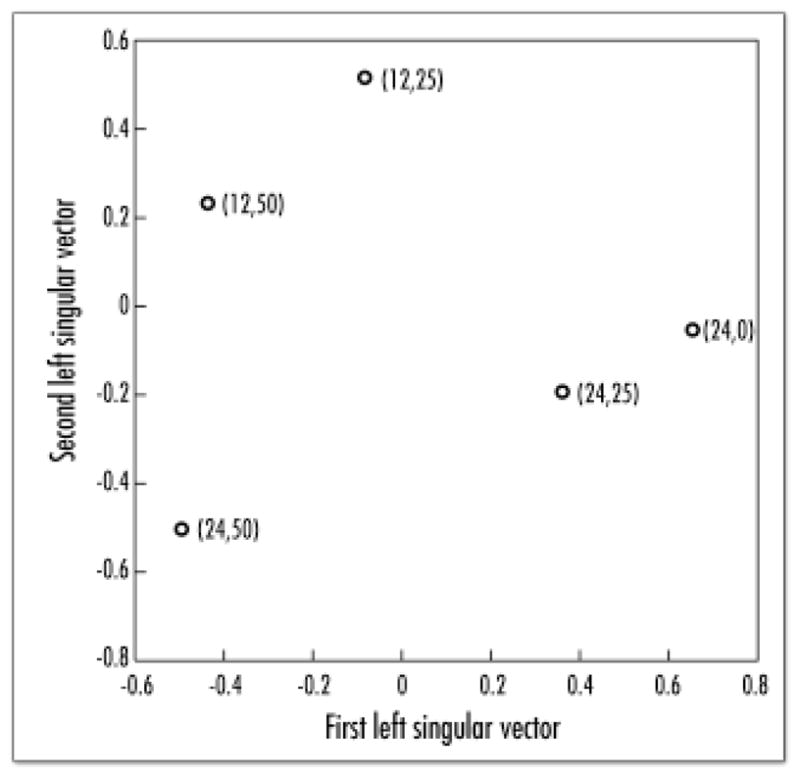
Figure 5.

SVD projection of the five gene expression profiles onto a space spanned by the first two left eigenvectors. Profiles of RCC 54 treated with RE at 50 μM are clustered together while the profiles RCC54 treated with 25 μM are clustered into a distinct group. The profile of control RCC54 treated with ethanol only is well separated from the RE treated profiles.
