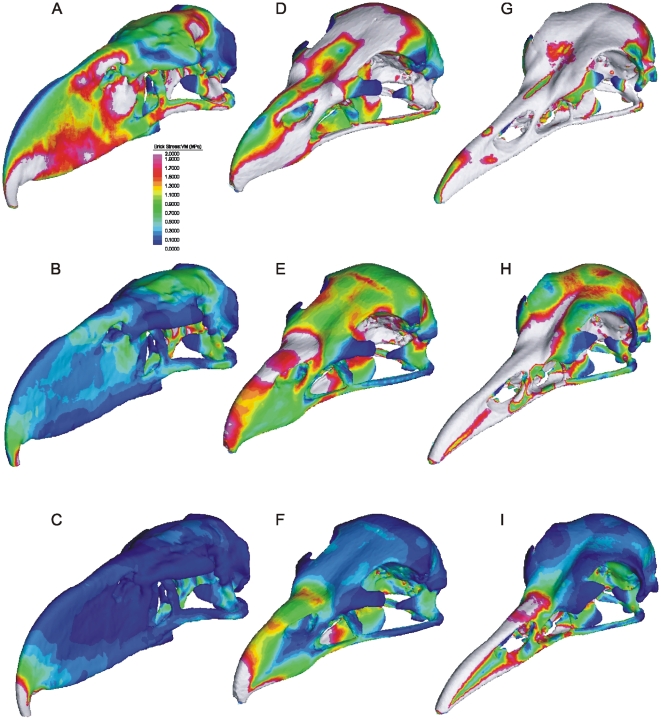
Figure 2. Stress (Von Mises) distribution of FE models.
(A–C) Andalgalornis steulleti, (D–F) Haliaeetus albicilla and (G–I) Cariama cristata under three loads cases: (A, D, G) lateral shake, (B, E, H) Normal Bite and (C, F, I) Pullback. VM = Von Mises; MPa, mega pascals. White areas indicate VM exceeds the scale maximum (2 MP) at those areas.

