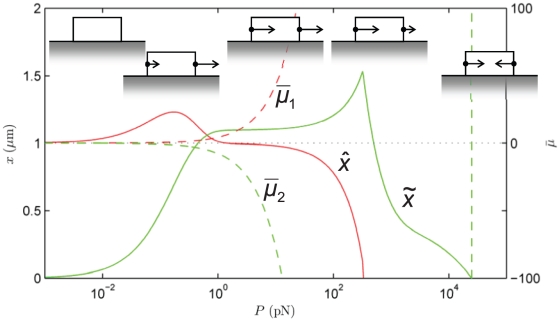
Figure 4. State diagram of the final position of the focal adhesion's centroid,  , and length,
  at
at  s as a function of force,
  .
.
Also shown are the normalized chemical potentials,  and
and  at the distal and proximal ends, respectively. The schematic diagrams indicate the dynamics corresponding to each regime. Note the various modes attained as
  is varied.

