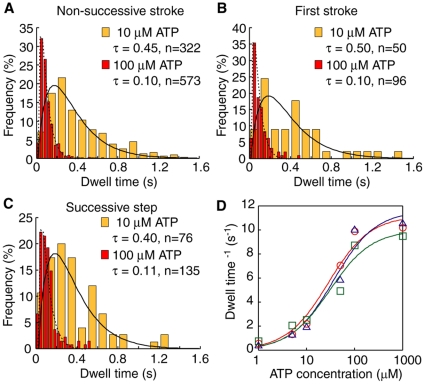
Figure 4. Dwell time of M5SH.
(A, B, C) Histograms of dwell times for non-successive strokes (A), first strokes (B) and successive steps (C) for M5SH. The successive step was excluded from the analysis for first strokes. Orange bars indicate data for 10 µM ATP; red, 100 µM ATP. Lines indicate fitting results to the double exponential curve f(t) = (k 1·k 2/(k 1−k 2)}/(exp(k 2 t)−exp(k 1 t)} (solid, 10 µM ATP; broken, 100 µM ATP). The mean dwell times (τ) were calculated as τ = [1/k 1+1/k 2]. (D) ATP concentration dependency of dwell times (red circles, non-successive strokes; blue triangles, first strokes; and green squares, successive steps). The dwell time represents ATPase rate per second assuming each step corresponds to a single ATP hydrolysis event. Solid lines indicate fitting results assuming monophasic Michaelis-Menten kinetics. Vmax and Km were 11 s−1 and 28 µM for non-successive strokes, 11 s−1 and 36 µM for first strokes, and 10 s−1 and 30 µM for successive steps, respectively.

