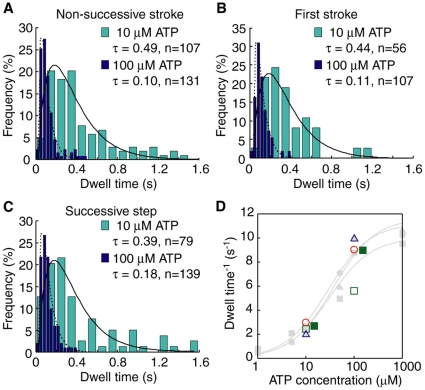
Figure 5. Dwell time of M5DH.
(A, B, C) Histograms of dwell times for non-successive strokes (A), first strokes (B) and successive steps (C) for M5DH. The successive steps were excluded from the analysis for first strokes. Cyan bars indicate data for 10 µM ATP; blue, 100 µM ATP. Lines indicate fitting results with a double exponential curve (solid, 10 µM ATP; broken, 100 µM ATP). τ are the mean dwell times. (D) ATP concentration dependency of dwell times (red circles, non-successive strokes; blue triangles, first strokes; and green squares, successive steps). The green solid square was obtained from data under a low load (<1.5 pN). Gray symbols and lines indicate M5SH results (see Fig. 4 D ).

