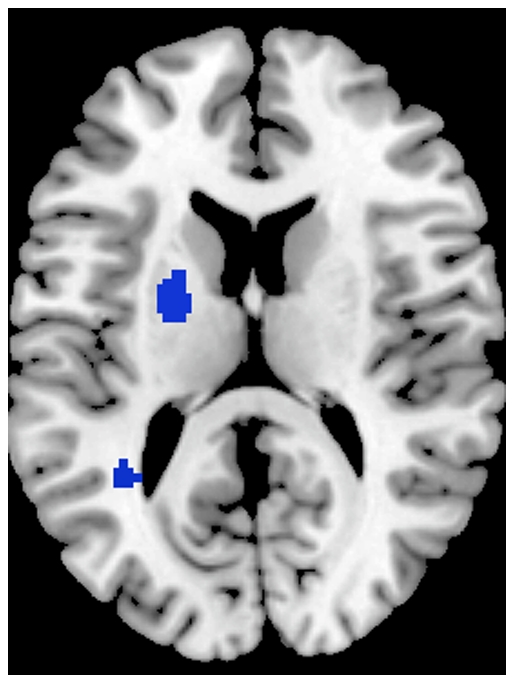
Figure 2. Greater grey matter volumes in ASD and Schizophrenia.

Clusters indicating relationship between brain regions and condition are colour-coded as follows: blue for clusters contributed to mostly by schizophrenia studies, yellow for clusters contributed to mostly by ASD studies, and green for clusters contributed to by both conditions.
