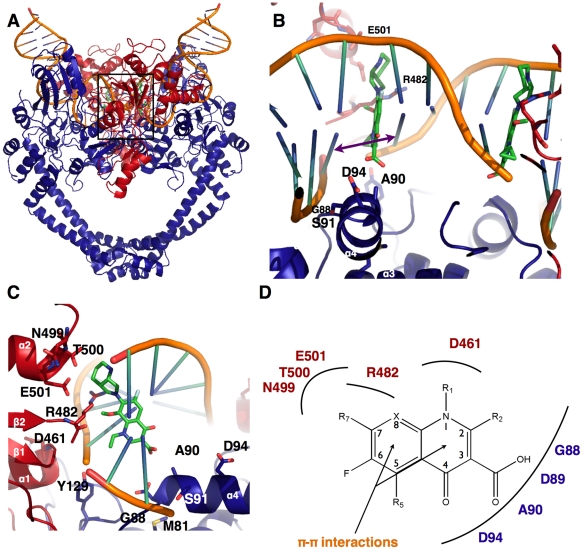
Figure 6. Model of the catalytic reaction core in complex with DNA and moxifloxacin.
A. Overall structure of the complex. GA57BK is represented in blue, TopBK in red, the DNA in orange and the moxifloxacin in green. B. Close-up view of the two quinolone-binding pockets (QBP). The purple arrow highlights the rise of the intercalated base step that constitutes the DNA walls of the QBP. Protein residues that constitute the QBP protein walls are indicated in red for TopBk and blue for GA57BK. The residues shown in sticks belong to the QRDR and are implicated in quinolone resistance. C. Close-up view along the DNA axis of one of the two QBP. The same residues as in B are represented in sticks. D. Schematic representation of the interactions between QBP residues and chemical groups of the quinolone.

