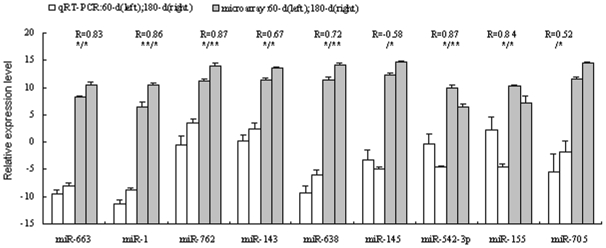
Figure 1. Validation of the microarray results using qRT-PCR method.
The X-axis represents the miRNAs and the Y-axis shows the relative expression levels of miRNAs (-ΔCt values for qRT-PCR; Log(sample signal, 2) for microarray). The number of biological replicates is three for both assays. R represents the Pearson correlation coefficient. The significance of differences for the expression between 60-d (immature, 60-day) and 180-d (mature, 180-day) testes was calculated using two-tailed T-test. *, p≤0.05; **, p≤0.01 (left for qRT-PCR, and right for microarray).

