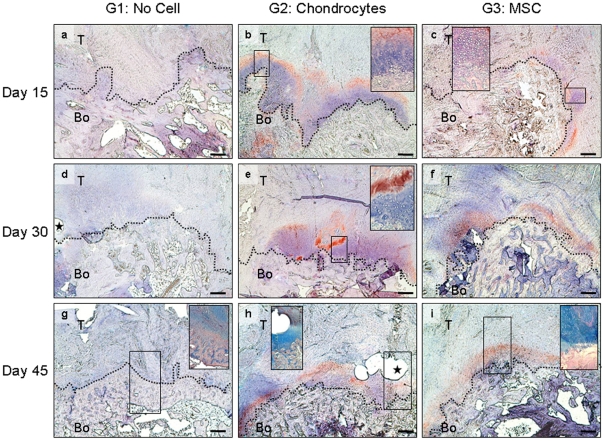
Figure 3. Enthesis production induced by cell therapy after repair.
Immunostaining of collagen II in the enthesis of control G1 rats (a, d, g), chondrocyte-injected G2 rats (b, e, h) and MSC-injected G3 rats (c, f, i) 15, 30 and 45 days after repair. There was no collagen II staining of G1 control enthesis on day 15 (a), whereas the bone-tendon junction of cell-injected rats was positively stained (b, c). Chondrocyte- (b) and MSC-treated repairs (c) also contained large aggregates of cells on top of the bone that corresponded to injected cells. (b, c insets) Higher magnification views of delimited areas showing cell aggregates. There was no type II collagen matrix detected in the repairs without cells on day 30 (d). Cell therapy was associated with the deposition of a collagen II matrix, which appears to be more abundant when chondrocytes were injected (e) than when MSCs were used (f). Insert in (e) is a higher magnification view of the delimited area of the corresponding panel, showing cell aggregates close to the collagen II matrix at the bone-tendon junction 30 days post repair. There was neither type II collagen matrix (g) nor GAG (g, inset) in the G1 repairs without cells 45 days post repair. In contrast, a homogeneous collagen II- and GAG-rich matrix covered the bone at the tendon insertion in the cell-injected rat (h, i). Insets (g-i) show alcian blue staining of GAG in the delimited area in the corresponding panel. Bone (Bo) is localized at the base of the image and tendon (T) above it. Tendon and bone areas are delimited by dotted lines. Stars show the hole left by the suture used for repair. Scale = 200μm.

