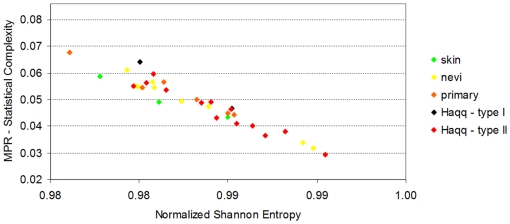
Figure 4. Scatter plot of the samples of the melanoma dataset contributed by Haqq et al.
It presents the MPR-Statistical Complexity of each sample as a function of its Normalized Shannon Entropy. This dataset contains information of 14,737 probes and 37 samples. The samples include 3 normal skin, 9 nevi, 6 primary melanoma and 19 melanoma metastases (these samples are 5 of melanoma metastasis ype I and 14 of type II, as labelled by Haqq et al). Following Haqq et al's original classification, the two types of melanoma metastases they identified are presented with different color coding. The plot illustrates that in this case, the Normalized Shannon Entropy does not help to differentiate the normal to metastatic progression (as it happened in the case of prostate cancer). We will show in Figure 5 that the modified statistical complexities M-skin and M-metastasis allow visualizing a clearer transitional pattern.

