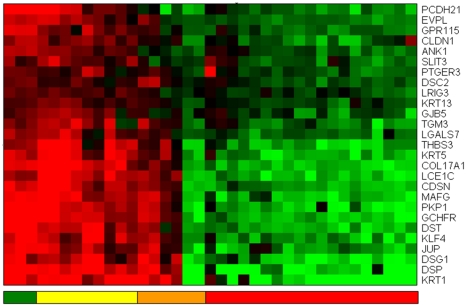
Figure 8. Heat map of the expression of 27 probes with genes annotated showing functions on cell adhesion, cell-cell communication, tight junction mechanisms and epithelial cell polarity.
The average expression of the skin samples is shown in green. In yellow, the nevi samples, showing that some of them have a reduced average expression. The primary melanomas have a mixed behaviour (orange columns) with four of them having almost zero of negative average expression. The metastatic samples (columns in red) have all a negative average expression. Overall the figure indicates a progression, from the positive average expression of this gene panel for nevi and normal skin samples, towards negative expression values of the metastatic samples, “passing” through the mixed behaviour present in primary melanomas.

