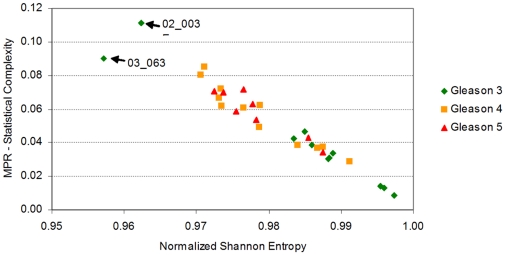
Figure 12. Scatter plot of the samples in the prostate cancer dataset contributed by True et al., presenting the MPR-Statistical Complexity of each sample as a function of its Normalized Shannon Entropy.
The dataset contains the expression of 13,188 probes and 31 samples. The samples include 11 samples labelled ‘Gleason 3’ (in green), 12 ‘Gleason 4’ samples, and 8 ‘Gleason 5’ (in red). Two samples seem to be outliers to a generic trend, which is somewhat expected. We do expect samples with a ‘Gleason 3’ label to have higher values of Normalized Shannon Entropy. This is indeed the case, no sample with a ‘Gleason 3’ label has a value of Normalized Shannon Entropy lower than 0.985, while 14 samples corresponding to samples which are either ‘Gleason 4’ or ‘Gleason 5’ have values smaller than that threshold. In agreement with some of the caveats discussed by True et al., there exist a group of samples that, irrespective of their label, have similar values of Normalized Shannon Entropy (near 0.992). Samples 02_003E and 03_063 seem to be outliers to this trend, and in the case of 03_063 the sample is not even close to a hypothetical linear fit which seems to be the norm for all the samples. Figure 13 will provide further evidence that may indicate that these two samples are outliers or not to the overall trend.

