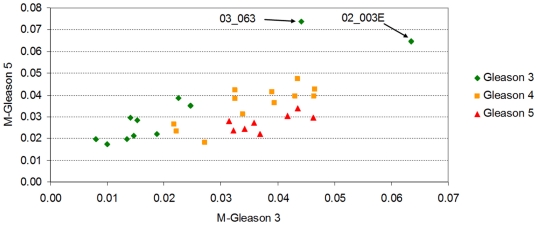
Figure 13. Scatter plot of the samples in the prostate cancer dataset contributed by True et al.
We have used the same color coding convention we have used in Figure 12. We plot the values of two modified statistical complexities, which we will call M-Gleason 3 and M-Gleason 5. Instead of using the equiprobable distribution as our probability distribution of reference (for the computation of the Jensen-Shannon Divergence of the gene expression profile to this distribution), as required for the MPR-Statistical Complexity calculation, we used a different one. For the M-Gleason 3, the probability distribution of the reference is obtained averaging all the probability distributions of the samples that have been labelled as Gleason 3 (analogously, we calculated M-Gleason 5). This is analogous to our approach in melanoma (Figure 5) in which we used normal and metastatic samples as reference sets for a modified statistical complexity. We observe that, even in this case, 02_003E and 03_063 continue to appear as outliers. In addition to the evidence, we have observed that the deletion of these two samples did not significantly alter the identification of biomarkers.

