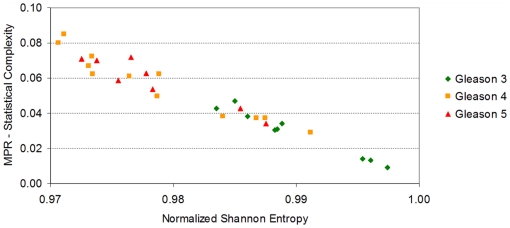
Figure 14. A region of interest of Figure 12 containing the 29 samples to be used in the analysis.
Due to the characteristics of this microarray dataset and the experiment setting, the Normalized Shannon Entropy correlates well with the established clinical notions of malignancy (high Gleason patterns). Most Gleason pattern 5 samples (in red) have lower values of Normalized Shannon Entropy than Gleason pattern 3 samples.

