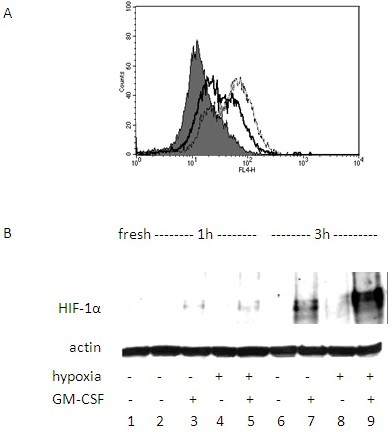
Figure 3.

HIF-1α expression by eosinophils. (A) Flow cytometry analysis of intracellular staining for HIF-1α in eosinophils incubated in normoxia (solid line) or hypoxia (dashed line) up to 3 h. (B) Western blot analysis for HIF-1α levels in eosinophils incubated in normoxia or hypoxia with or without GM-CSF for 3 h. Data are representative of three experiments.
