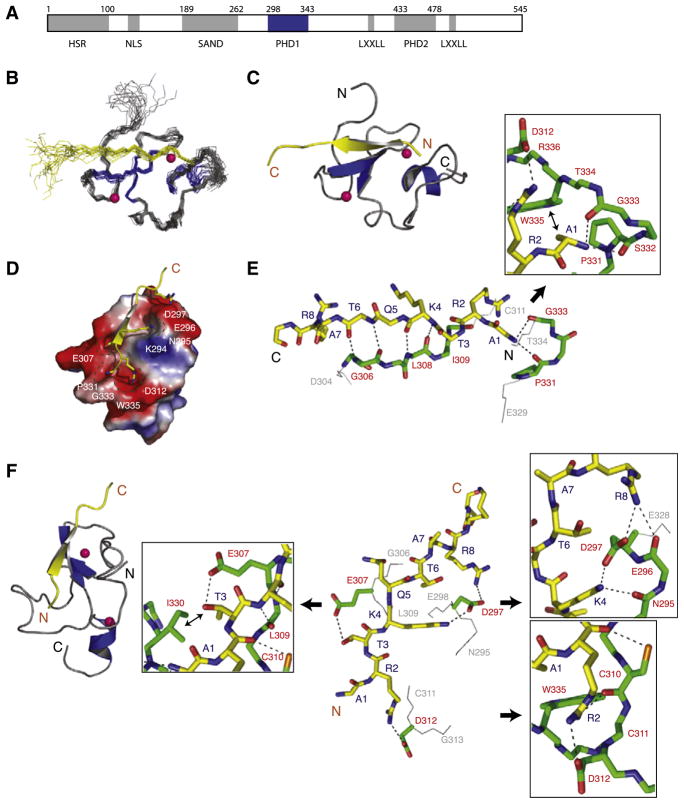
Figure 1. Three-Dimensional Solution Structure of the AIRE-PHD1/H3K4me0 Peptide Complex.
(A) Schematic representation of the functional domains in the human AIRE protein. Grey boxes represent HSR (homogenously staining region), PHD (plant homeodomain), and SAND (Sp100, AIRE-1, NucP41/P75, and Drosophila DEAF-1). PHD and SAND domain boundaries are based on Pfam HMM (Bateman et al., 1999) and remaining segments are based on Meloni et al. (2008). AIRE-PHD1 studied here is shown in blue.
(B) Backbone atoms (N, Cα, and C′) of the 20 superposed NMR structures of the AIRE-PHD1 where protein and peptide are gray and yellow, respectively (left).
(C) Ribbon representation of the complex (middle) highlights the secondary structural elements (protein, blue; peptide, yellow). Pink spheres represent Zn atoms. Only a single representation of Zn atoms of the lowest energy structure is shown in the ensemble for clarity.
(D) Electrostatic potential (isocontour value of ±70 kT/e) surface representation of the AIRE-PHD1 bound to the H3K4me0 peptide (yellow).
(E) Backbone protein-peptide interactions with inset showing the H3A1 interacting neighborhood. The peptide and protein residues are color coded by atom type with carbon atoms in yellow and green, respectively. The orientation of the peptide is the same as that in (C).
(F) Key protein-peptide side-chain interactions with insets respectively highlighting R2, K4, and T3 neighborhood and their surface grooves. The nonpolar nonbonded interacting atoms are labeled with ↔. The peptide orientation in the stick representation is depicted as in the ribbon diagram on left.

