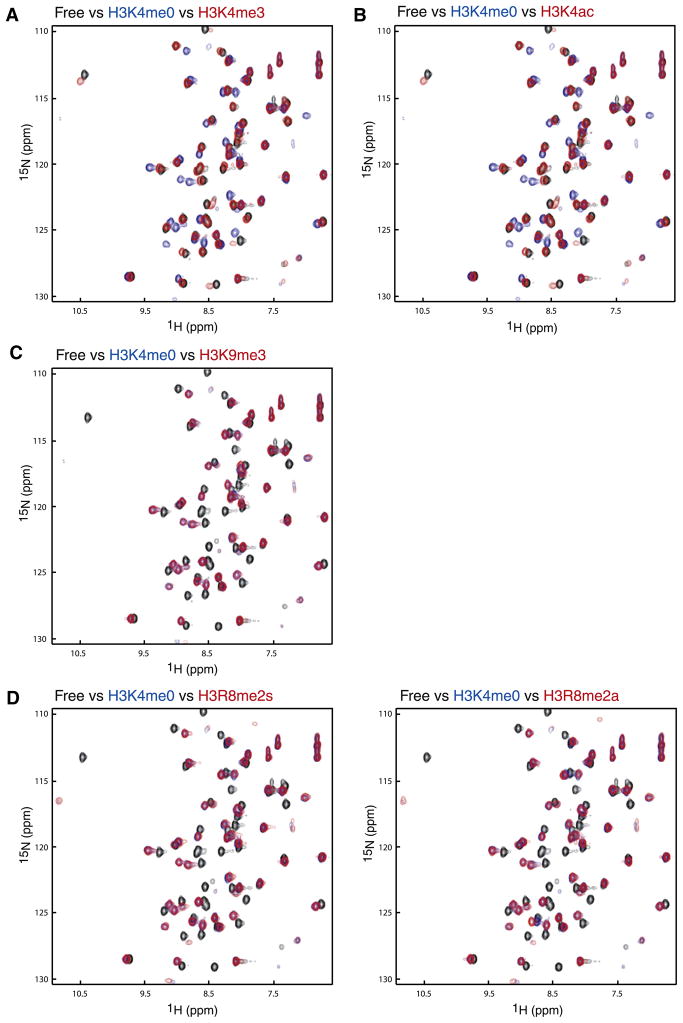
Figure 2. Peptide Binding Studies.
Peptide binding studied between AIRE-PHD1 and N-terminal H3 peptides by NMR. Comparison of two-dimensional 1H-15N HSQC spectra of AIRE-PHD1 between its free form (black) and that in presence of a peptide derived from N-terminal H3 residues 1–11 with or without a known post-translational modification: (A) H3K4me0 (blue) versus H3K4me3 (red); (B) H3K4ac (red); (C) H3K9me3 (red); (D) H3R8me2a (red), left panel, and H3R8me2s (red), right panel. The concentration of the protein was 0.5 mM, and the molar ratio of the protein to peptide was kept at 1:5 for all NMR binding studies.

