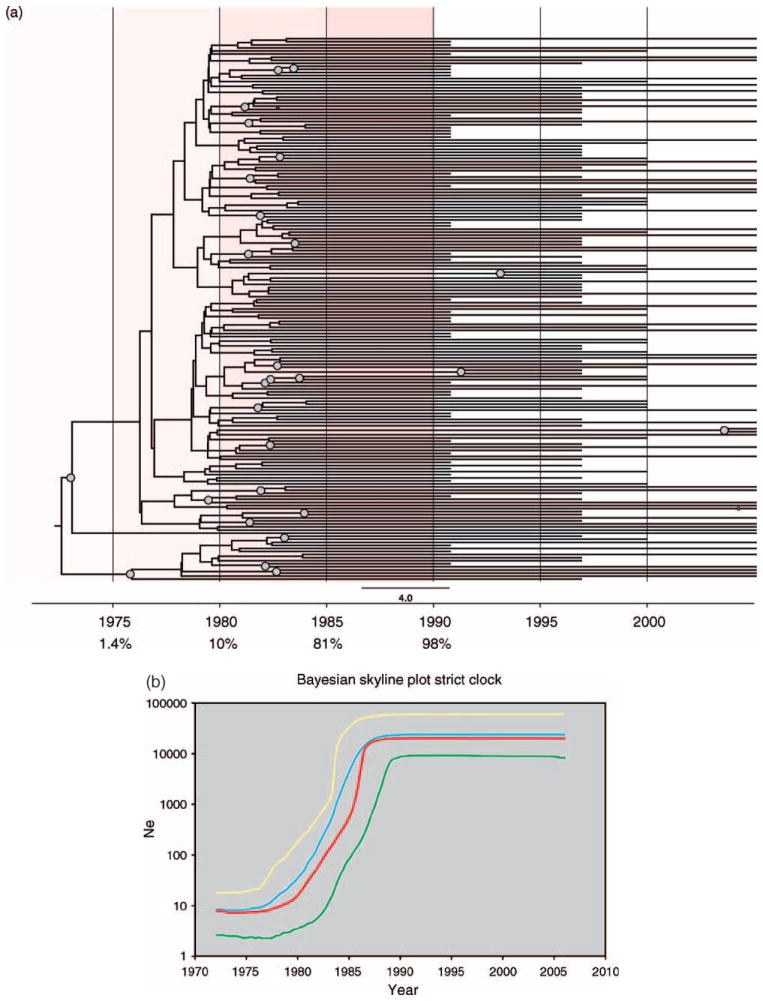
Fig. 2.
(a) Bayesian maximum clade-credibility tree for HIV-1C pol in Zimbabwe. Maximum clade-credibility trees were estimated using BEAST from a posterior distribution of 10 000 Bayesian trees employing constant population size, exponential growth, and Bayesian skyline plot (BSP) coalescent tree priors and enforcing either a strict or relaxed molecular clock (BSP relaxed clock shown). Nodes with greater than 0.5 posterior probability are marked with gray circles. The estimated median percentage of present-day (2006) strains in Zimbabwe that were present in 1975, 1980, 1985, and 1990 is indicated in the tree, with red highlighting marking the time period during which the highest increase in HIV subtype C strain diversity was recorded in Zimbabwe. (b) Bayesian skyline plot of HIV-1C pol demographic growth patterns in Zimbabwe. Nonparametric estimates of HIV-1 effective population size (Ne) over time were estimated from 177 Zimbabwean pol sequences employing a Bayesian Skyline plot coalescent tree prior in BEAST. The X-axis represents year and the Y-axis represents HIV-1 effective population size (effective number of infections, Ne; log10 scale). The red line marks the median estimate for Ne and yellow and green lines represent the upper and lower 95% highest posterior density (HPD) estimates, respectively.  , Bayesian skyline;
  , median;
  , upper;
  , lower

