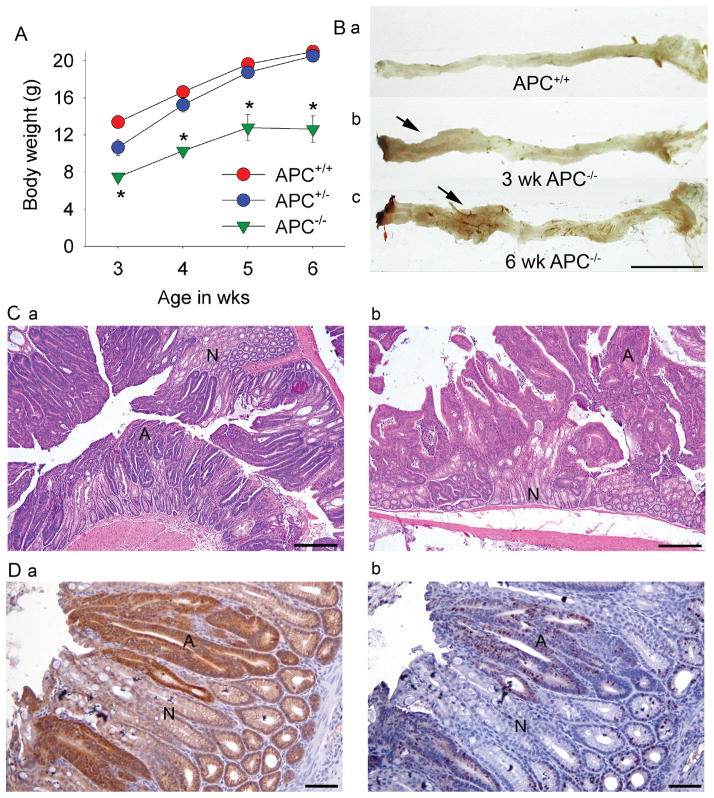
Figure 4. Analysis of the phenotype of wild-type (APC+/+) CAC;APC580S/+ (APC+/−), and CAC;APC580S/580S (APC−/−) mice.
(A) Growth curves. * significantly less than APC+/+ mice p<0.05. (B) Representative images of colorectal appearance in (a) APC+/−, (b) 3 wk-old APC−/−, and (c) 6 wk-old APC−/− mice (arrows = raised mucosal lesions). Bar = 1 cm. (C) Representative H&E stained sections of distal colon in (a) 3 wk-old and (b) 6 wk-old APC−/− mice. Bar = 500 μm; N = normal epithelium, A = adenoma. (D) Immunuhistochemical labeling of step sections from the distal colon of 3 wk-old APC−/− mice for (a) β-catenin and (b) Ki-67.
Arrow = a microadenoma. Bar = 100μm.

