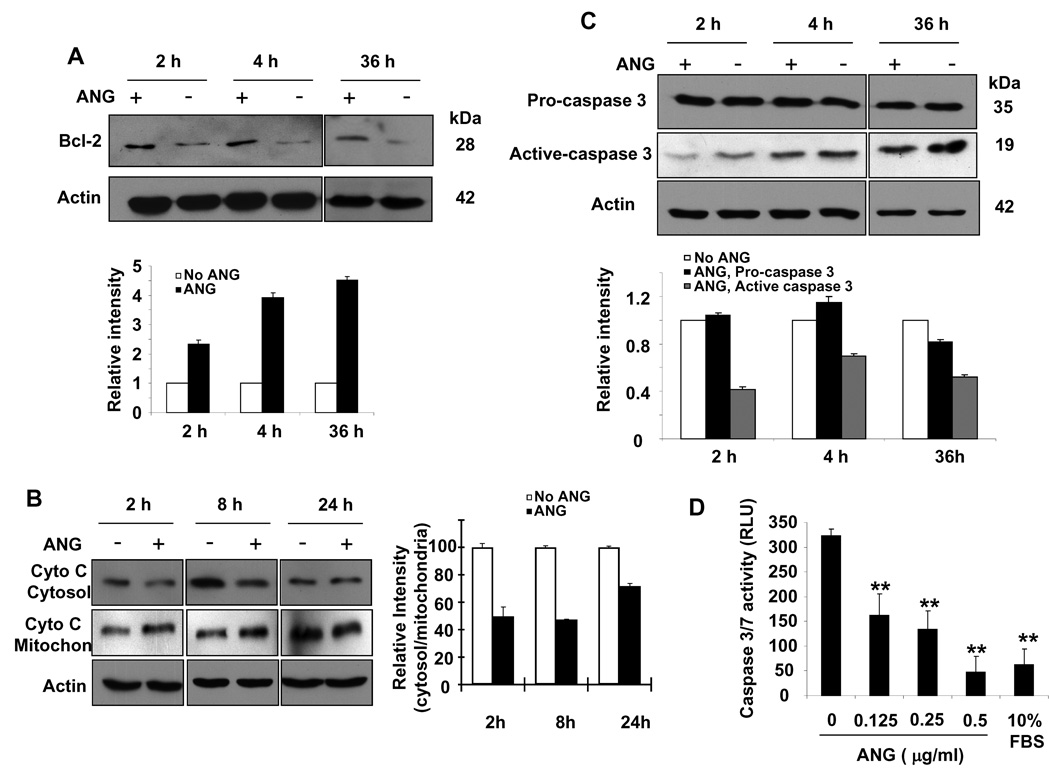
Fig. 3.
ANG enhances Bcl-2 expression, blocks cytochrome c release and inhibits caspase activity. P19 cells were cultured in serum-free medium in the absence or presence of ANG (0.5 µg·mL−1) for the indicated times. (A) Total cell lysates were used for western blotting detection of Bcl-2. The bar graph below the western panel is the relative density of Bcl-2 with β-actin as the normalization control. (B) Cytosolic and mitochondrial proteins were isolated and used for western blotting detection of cytochrome c (Cyto C). The bar graph on the right is the relative abundance of cytochrome c in the cytosol versus that in the mitochondria. (C) Western blotting analysis of pro- and active caspase 3 in the total cell lysate. The bar graph below the western panel is the relative density of Bcl-2 with β-actin as the normalization control. (D) Effect of ANG on caspase activity. Caspase activities were measured using Apo-ONE Caspase 3/7 Reagent.

