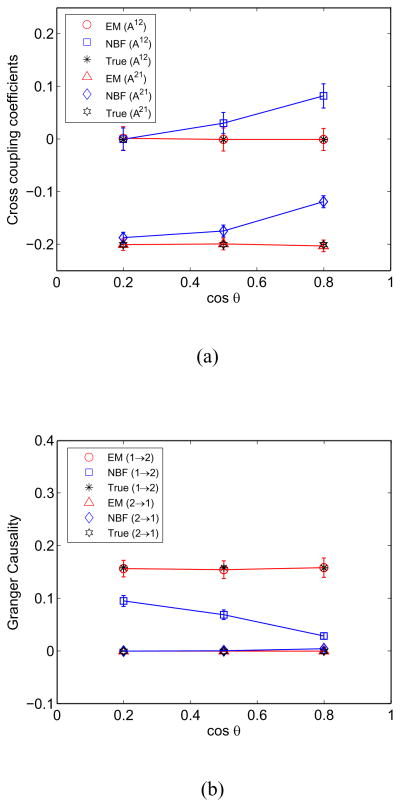
Fig. 3.
EM and NBF approach performance as a function of the angle between source forward models estimated over 100 runs at SNR = −5 dB. Error bars denote one standard deviation. (a) MVAR cross coupling coefficients A12 and A21. (b) Granger causality metric from source 1 to source 2 and source 2 to source 1.

