
Fig. 6.
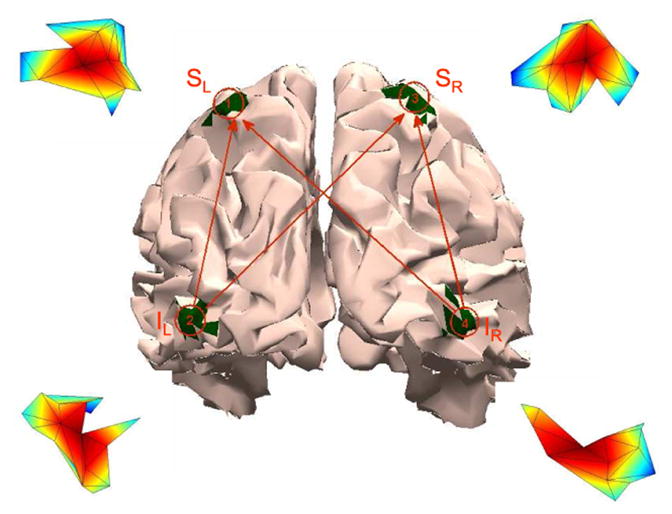
Inferior occipital gyrii (IL and IR) and superior parietal lobules (SL and SR) are shown in green on a rear view of the brain. The line drawing superimposed on the brain illustrates the causal influences simulated in Examples 3 and 4 while the insets near each ROI depict the simulated spatial activity distribution