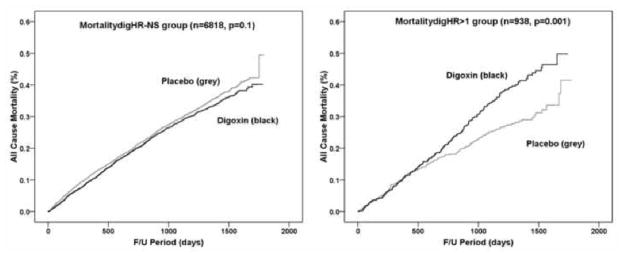
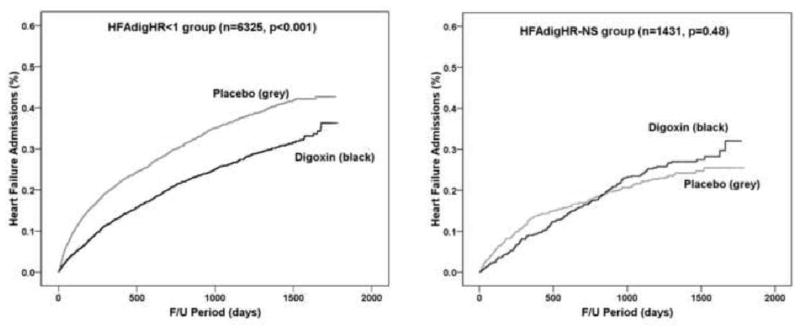
Figure 1. Survival analysis using Kaplan Meier curves comparing digoxin use with placebo.
A. All cause mortality in the digoxin and placebo treatment groups. Left panel represents the Kaplan Meier 1-survival curves for all cause mortality among clusters of patients with no significant association of digoxin with mortality (MortalitydigHR-NS). Right panel represents the Kaplan Meier 1-survival curves for all cause mortality among clusters of patients with a significant increase in mortality with the use of digoxin (MortalitydigHR>1). B. Incidence of hospitalization due to worsening HF (HF Admission) in the digoxin and placebo groups. Left panel represents the Kaplan Meier 1-survival curves for hospitalization due to worsening HF among clusters of patients with a significant reduction in HF hospitalization with the use of digoxin (HFAdigHR<1). Right panel represents the Kaplan Meier 1-survival curves for hospitalization due to worsening HF among clusters of patients with no significant association of digoxin with HF hospitalization (HFAdigHR-NS).


