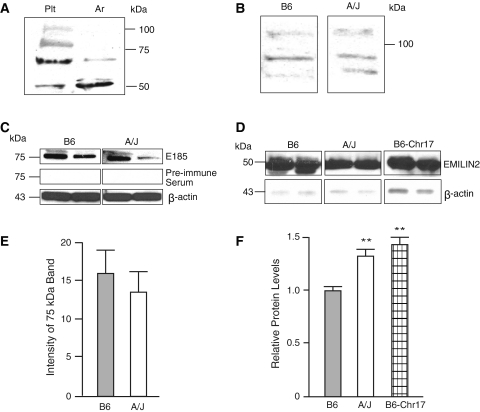
Fig. 3.
a–d Western blot of EMILIN2 with antibody E185, from tissue homogenates. a Platelets (Plt) and aorta (Ar) from B6 mice. b Platelets from B6 and A/J mice. c Peritoneal macrophages from B6 and A/J mice. d Plasma from B6, A/J, and B6-Chr17 mice. e Density of 75-kDa bands from Western blot of EMILIN2 protein in peritoneal macrophages from B6 and A/J relative to β-actin. Values are mean ± SEM of four mice per strain. f Density of 50-kDa bands from Western blot of EMILIN2 in plasma. Values are mean ± SEM of six mice per strain. Statistical differences were determined by a t test or ANOVA and Newman-Kuels post-test. ** P < 0 .01

