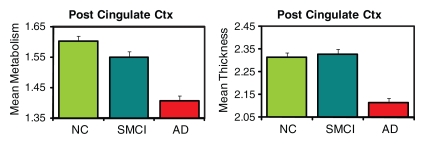
Figure 2b:
ROI mean metabolism and thickness or volume plots (metabolism on the left and thickness or volume on the right) for selected ROIs. All means are adjusted for age and sex by using a model that includes all three diagnostic groups. Means are plotted with standard error bars. (a) Selected mesial temporal ROIs. (b) Posterior (Post) cingulate cortex. (c) Selected lateral ROIs. Ctx = cortex, NC = HC.

