
Figure 2.
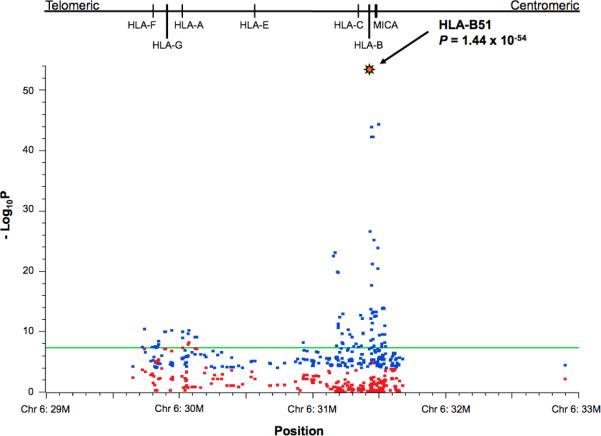
Analysis of associations within the MHC. The 292 SNPs from the MHC region with allelic Chi-squared P < 0.0001 are shown before (blue symbols) and after (red symbols) conditioning for HLA-B51. Blue symbols represent -log10 P (allelic Chi-squared test). Red symbols represent –log10 regressor P-values of the same markers from a logistic regression analysis with HLA-B51 specified as a covariate. The green horizontal line at –log10P = 7.301 corresponds to the genome-wide significance threshold of 5 × 10⁻⁸. The locations of HLA genes are shown above the association graph.