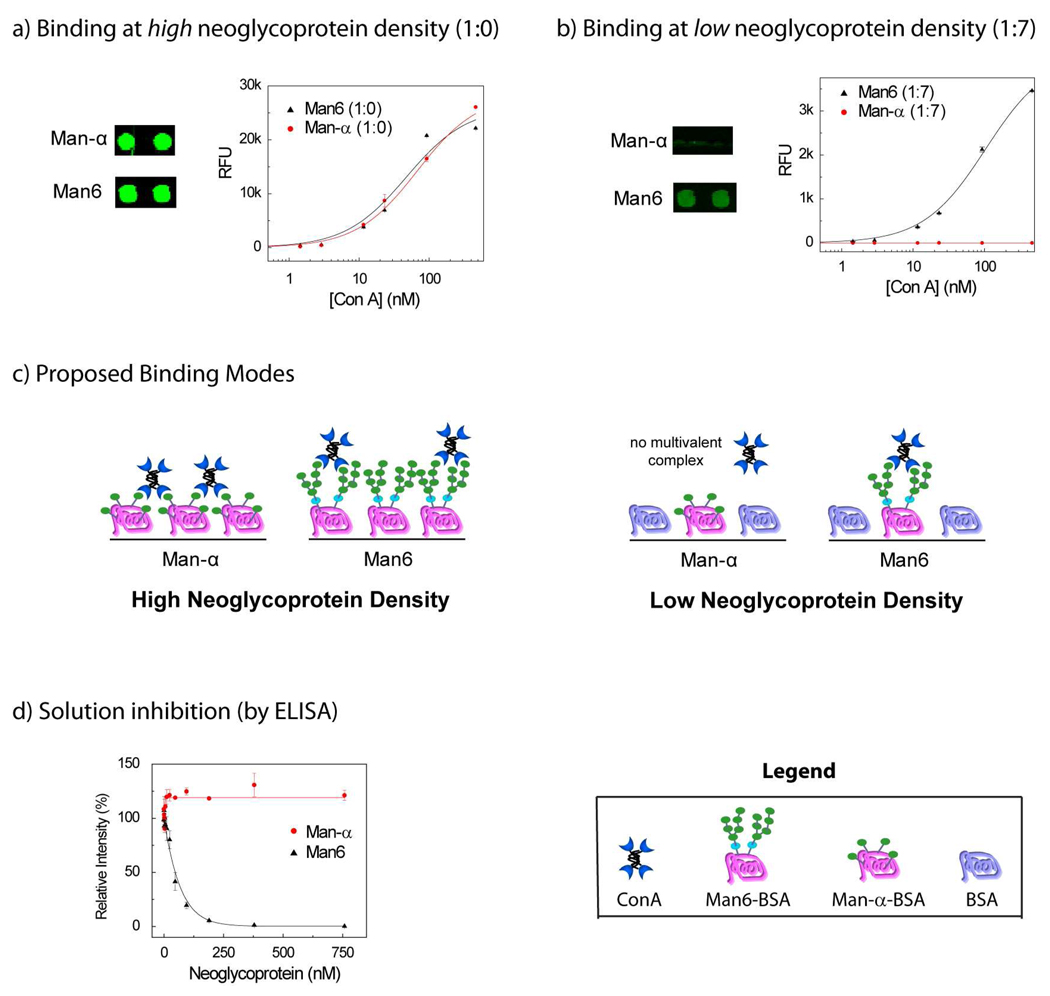
Figure 3.
Comparison of ConA binding to Man6 and Man-α a) ConA binding at high neoglycoprotein density (1:0); shown are pairs of spots for Man-α and Man6 at a single ConA concentration (189 nM) and binding curves over a range of ConA concentrations. b) ConA binding at low neoglycoprotein density (1:7); shown are pairs of spots for Man-α and Man6 at a single ConA concentration (189 nM) and binding curves over a range of ConA concentrations. c) Proposed binding modes at high and low neoglycoprotein density. At high density, ConA binds Man-α via a bridging complex and Man6 via a 1:1 complex. At low neoglycoprotein density, a bridging complex with Man-α cannot be formed. d) Inhibition of ConA binding was evaluated by an ELISA-like assay at a range of neoglycoprotein concentrations and inhibition curves are shown for Man6 and Man-α. Man6 shows good inhibition while Man-α shows no inhibition.

