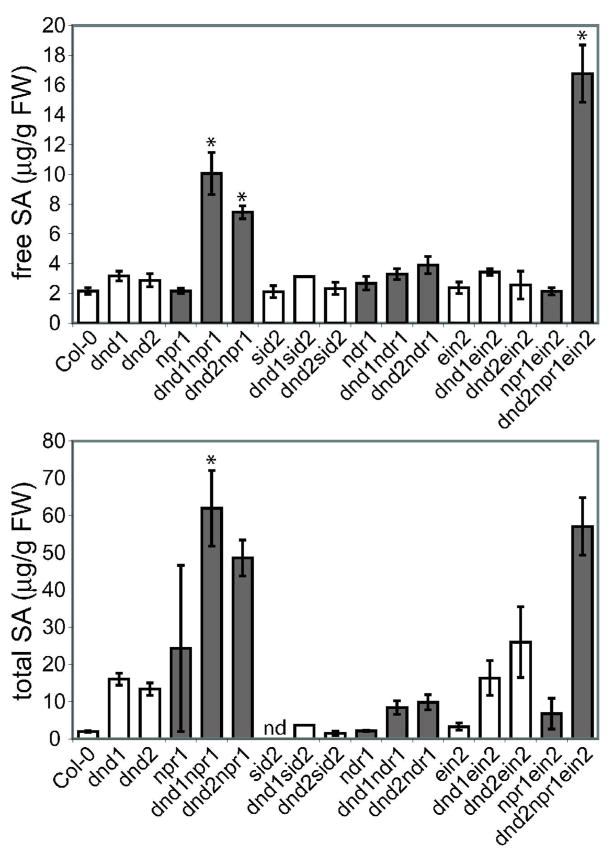
Figure 3.
Salicylic acid (SA) levels in single, double and triple mutants. Free (unconjugated) and total SA in leaves of four-week old plants. Four replicates were measured for each genotype within each experiment; error bars represent standard error of the mean. Similar genotypes are grouped by shading; asterisks denote plant lines for which SA levels were significantly different from the parental line that is left-most within the similarly-shaded group of bars (ANOVA P < 0.05; Tukey test). Similar results were obtained in a second, independent experiment. nd: not detectable.

