Abstract
We are conducting a two-phase study, which aims to select design parameters of a long-axis positron emission tomography (PET) scanner that are a compromise between detection performance and cost. In this first phase, we examine the effects of axial length, detector thickness and collimator geometry on the noise equivalent count rate per axial length (λNEC) and noise equivalent count rate per slice (dNEC). We use these metrics as approximate, but quickly computed, indicators of a PET-scanner's performance at a detection task. From this first phase, we select a subset of scanner designs for which we can conduct a detailed study of tumor detectability and quantitation accuracy in whole-body PET imaging.
I. Introduction
Large axial field-of-view (AFOV) positron emission tomograph (PET) scanners have been proposed and developed [1-5] as a means for improving sensitivity for whole-body imaging. Notably, Poon, et al. [5] have used a cylindrical-detector PET simulation to examine noise equivalent count rate (NEC) of a 2-meter-long 3D-PET scanner with 3-cm-thick LSO detectors. Motivations for improving scanner sensitivity include increase in signal-to-noise ratio (SNR) and decreases in patient dose, scan time, and patient motion. A longer AFOV PET scanner is also desirable for dynamic whole-body imaging. However, design parameters of a long-AFOV PET scanner and their tradeoffs for a whole-body imaging task remain largely unexplored.
The present work is the first of a two-phase study that aims to optimize PET-scanner design parameters for use in whole-body PET-imaging studies. In this first phase, we seek scanner design parameters that are optimized for a detectability task. The NEC of a scanner has been shown to correlate to SNR and lesion detectability in resulting images [6]. However, in comparing scanners of different AFOV, we divide NEC by the length of the AFOV (denoted λNEC) as an approximate metric for comparing SNR and sensitivity/cost. Increase in λNEC with AFOV would denote a possible synergy for detectability in extended AFOV scanner.
II. Materials and Methods
To explore PET-scanner design parameters, we use a new block-detector version of Simulation System for Emission Tomography (SimSET version 2.9) [7]. SimSET is a photon-tracking Monte-Carlo simulation tool. It was used to simulate single and coincident count rates for each of the different scanners in the parameter space explored.
A. Scanner, Detector and Phantom Models
The generic PET-scanner design considered (Fig. 1), consists of 70 block-detector modules per ring. The number of detector blocks along the AFOV is parameterized. Collimator septa (when used) are made of tungsten and the end caps of the collimator and detectors are 5 cm of lead. Dimensions and spacing of the septa are parameterized. A table of varied tomograph parameters and their values are given in Table 1.
Fig. 1.
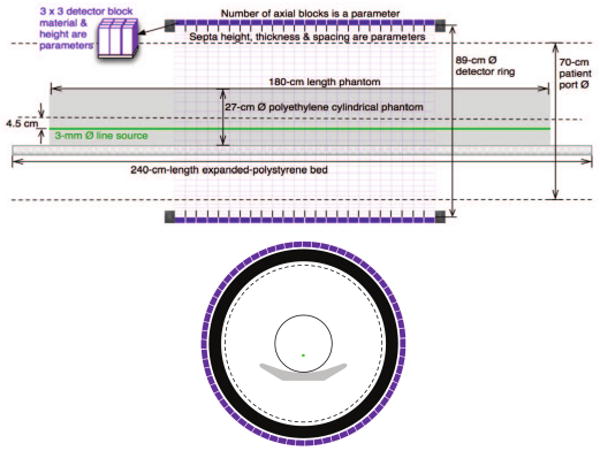
Model of PET scanner, block detector, and cylindrical phantom: (top) side view (bottom) end view. A detector block is 3.8-cm wide and spaced 3.95-cm center-to-center.
Table. 1.
Scanner design parameters and values we simulate. “Exhaustive” and “excursion” values indicate the extent of parameter space simulated (i.e. all combinations of exhaustive values were simulated).
| Parameter | Symbol | Exhaustive | Excursion | Units |
|---|---|---|---|---|
| Axial FOV | LAFOV | 4, 12, 24, 54 | 8, 18, 30 36, 42 | blocks |
| Det. thickness | Hdet | 3 | 2, 1, 0.5 | cm |
| Septal height | Hcol | 5.4 | 2.5, 1.25, 0.625 | cm |
| Septal width | Wcol | 0.08 | 0.16, 0.32, 0.64 | cm |
| Septal spacing | Dcol | ⅙, 1, ∞ | ½, 2, 3 | blocks |
The entrance face of each detector block is 3.8-cm on a side (square) and lies on a cylinder of diameter 88.6 cm. These blocks are axially spaced 3.95 cm center-to-center. The entrance faces of detectors are covered in 1 mm of a plastic surrogate (water) and the spaces between detector blocks (axially and trans-axially) are filled with Teflon. The height (thickness) of detectors is parameterized (see Table 1). We have also examined scintillators with different attenuations and energy resolutions (i.e. BGO, LSO, LaBr3). However, lacking an adequate metric to compare TOF and non-TOF scanners, we present only BGO results here.
The number of crystal elements per block may affect the outcome of a quantitation task. However, NEC is relatively insensitive to the crystal element size. Therefore, we coarsely subdivide detector blocks into 3-by-3 crystals only in order to examine the impact of maximum ring-difference (for 3D-to-2D rebinning) on NEC.
The simulated phantom is a 180-cm-long, 27-cm-diameter polyethylene cylindrical with a 3-mm-diameter full-length line source that is 4.5 cm off-center. We parameterize the activity and assume one-minute scan duration. This phantom is centered on the FOV axis and lies on a polystyrene patient bed.
B. Event Processing and Measures of Performance
Assuming that low-noise estimates of random and scatter coincident event rates are to be used in determining the true coincident event rate, we compute noise equivalent count rate (NEC) according to [8]:
| (1) |
where
| (2) |
(term prompts), is the total of true (T), scatter (S), and random (R) coincidence event rates. Coincidence event rates are reduced due to dead times resulting from single and coincident event processing. For this purpose, we use a paralyzable dead-time model as described in [9]. The overall live-time fraction for coincident events between ith and jth detector blocks (denoted LTFi,j) is taken as the product of three exponential terms resulting from detector-block event processing (for each of two detectors) and from coincidence event processing:
| (3) |
where Pin is the total coincidence load of the system before coincidence processing, but after block dead-time losses. In turn, we find:
| (4) |
Here, Pi,j is the coincidence load before block dead-time losses between the ith and jth detectors; si is the single-event rate for the ith detector block, τblock is the block dead-time constant, and τcoinc is the coincidence dead-time constant. A lower level discriminator (LLD) of 85 keV is assumed for triggered singles. Each of the coincidence rates (T, S, and R) are then summed across all pairs of detectors, whose connecting line (line of response or LOR) passes within 1 cm or less of the phantom; this is a region of interest (ROI) that is a 29.3-cm-diameter 182-cm-long cylinder centered at the scanner axis:
| (5) |
Furthermore, the obliquity for LORs included in this total were parametrically constrained; the maximum ring difference (maxRD) was parameterized over all possible values. An example of the resulting coincidence rates as a function of activity for fixed maxRD is shown in Fig. 2.
Fig. 2.
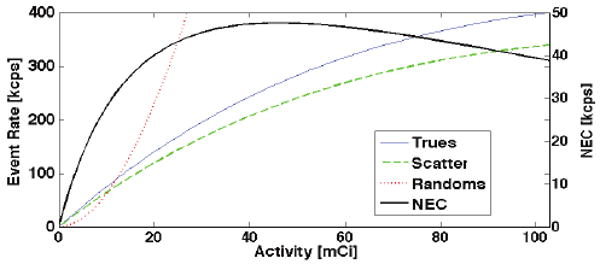
Example of count rates vs. activity: 3D 4-block-AFOV (15.8-cm long) scanner (maxRD=12) using the extended source distribution depicted in Fig. 1.
In comparing scanners with different AFOV we consider the NEC divided by the length of the AFOV (denoted λNEC). If we assume scanner cost scales roughly with the AFOV (holding detector design fixed), then λNEC is an approximate estimate of the NEC/cost ratio. Furthermore, for a short axiallength ROI (Lscan ≤ LAFOV) the NEC within this short ROI is approximately proportional to λNEC. In contrast, if we assume a fixed acquisition time for a Lscan ≥ LAFOV scan, then NEC within this long ROI is approximately equal to λNEC* LAFOV2/Lscan; thus, a constant or increasing λNEC with AFOV in this case corresponds to at least a quadratic improvement in the NEC with AFOV.
We computed λNEC for each scanner geometry as a function of source activity and maximum ring difference (maxRD). We show an example of this 2D surface for one scanner design in Fig. 3. Three curves are traced onto this surface to illustrate the NEC for different operational constraints:
Fig. 3.
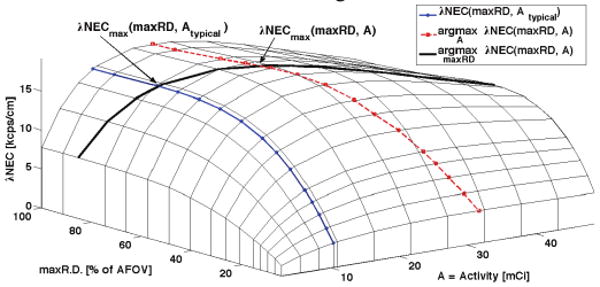
λNEC vs. activity and maxRD for a 24-block-AFOV (95-cm-long) tomograph with 3cm-thick BGO and axial septa every 2 blocks.
λNEC vs. maxRD for typical activity in a clinical whole-body scan, Atypical (1 hour post-injection of 15 mCi 18F),
λNEC maximized over activity vs. maxRD, and
λNEC maximized over maxRD vs. activity.
The intersection of these curves, l∩3 and 2∩3, give the maximum λNEC over maxRD given Atypical and the peak λNEC over all maxRD and activities, respectively. For all tomograph designs considered, the peak λNEC occurs at larger activity than is typical for clinical scans (ranging from a few percent to a factor of 10 larger). Therefore, in comparing λNEC for different tomographs, we take the maximum over maxRD for a typical clinical activity (1 hour post-injection of 15 mCi18F). However, in practice our selection of maxRD will be determined as a tradeoff between signal-to-noise and axial resolution of the reconstructed image.
III. Results
Representative λNEC results of the design parameter space examined are depicted in Fig. 4.
Fig. 4.
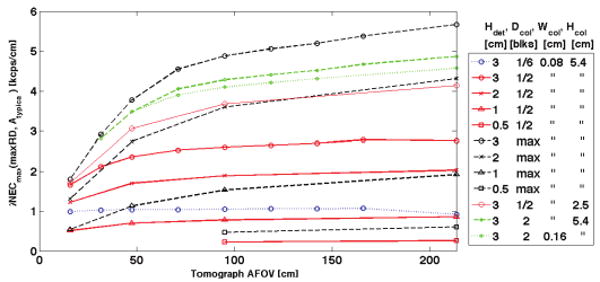
Maximum λNEC(maxRD, Atypical) vs. tomograph AFOV for different collimator geometries and detector thicknesses.
A greater-than-proportional increase of NEC is observed when increasing AFOV for most collimator configurations and detector thicknesses. This synergistic effect of increased AFOV on NEC is more enunciated for sparser collimation and increases more rapidly for tomographs less than 1 meter than for ones greater than 1 meter.
For 2D and 2.7D collimation (septa between every 1 or 3 detector rings) λNEC is nearly constant with AFOV and decreases above 1.5-meters AFOV. Decreasing septal height (Hcol) and increasing septal width (Wcol) result in a similar synergistic increase in NEC for longer-AFOV tomographs.
A 54-block-AFOV tomograph with l-cm-thick detectors and no septa (3D) has nearly the same λNEC (i.e. NEC in proportion to AFOV) as a 4-block-AFOV tomograph with 3-cm-thick detectors; other detector thickness and collimator combinations can be used to maintain the same λNEC.
Axial distributions of NEC per slice are shown in Fig. 5 for scanners with different AFOV, 3-cm-thick BGO detectors, and both 2D and 3D collimation geometries. We observe a significant drop in NEC for central slices resulting from increased random count rates. The corresponding rates for true, scatter and random coincidences are shown in Fig. 6 for the longest AFOV scanner in Fig. 5.
Fig. 5.
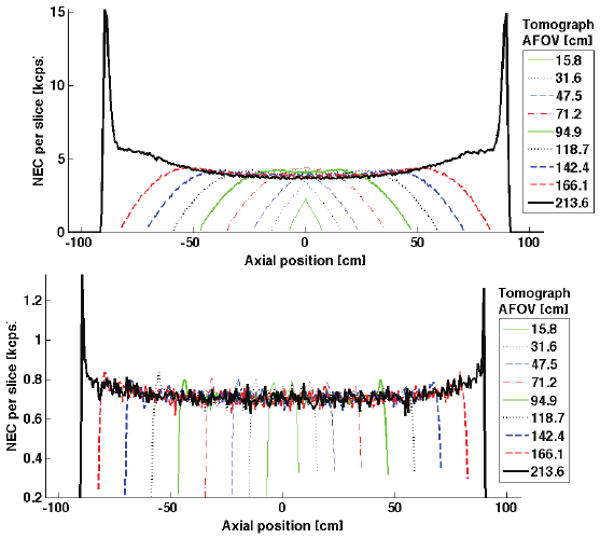
NEC per slice (dNEC) reveals the axial dependencies of NEC on tomograph design. Shown here is dNEC for various AFOV tomographs with 3cm-thick BGO and (top) 3D collimation and (bottom) 2D collimation. Maximum ring difference (maxRD) is chosen to maximize NEC in each case. The spike in dNEC near the ends of the longest tomograph are a feature of viewing the line-source through phantom edge (less attenuation); the area under this spike contributes less than 5% to the total NEC. Depression of dNEC for central slices of longer-AFOV scanners results from a local increase in the randoms rate.
Fig. 6.
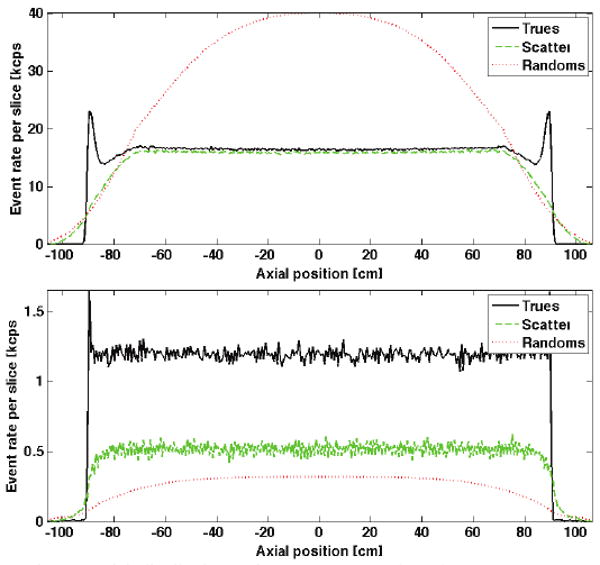
Axial distributions of true, scatter, and random count rates are shown for the longest-AFOV tomograph in each of the plots in Fig. 5: (top) 3D collimation and (bottom) 2D collimation.
For comparing to a previous cylinder-SimSET simulation study of a 2-meter-AFOV tomograph [5], we have summarized comparable results in Table 2 for a 54-block (2.136 meters) AFOV scanner that was part of our parametric-design study. In addition to mismatched AFOV, we expect differences in these two simulations to result from model differences in scanner geometry, patient-bed representation, phantom geometry (length and diameter), and singles LLD (Poon et al. used 50 keV and we used 85 keV). The effect of some model differences (block detector and patient bed representation) on resulting count rates are diminished by count-rate correction factors applied by Poon et al. [5]. With such large differences in tomograph and phantom models it is difficult to make a meaningful comparison. However, even with noted model differences, we are uncertain of the cause for the observed count-rate differences. We are still working to determine the reason for these differences. Furthermore, this ambiguity prompts us to seek a standard for comparing simulated long-axis tomographs in future work.
Table. 2.
Comparison with 2-meter scanner simulation by Poon, et al [5]. Several differences for the simulated models in these two studies are outlined in the text above. The two different simulated phantom diameters by Poon, et al. (20-cm and 35-cm) straddle the 27-cm-diameter phantom used for our study. For the purpose of this comparison, we use a scan-time activity of 407 MBq. As is suggested in [5], maximum ring difference was selected for 90% peak NEC at this activity.
| Units | Poon ∅20cm |
Poon ∅35cm |
54-block ∅27cm |
|
|---|---|---|---|---|
| maxRD | cm | 58.2 | 47.4 | 39.8 |
| Triggered singles | Mcps | 657 | 587 | 369 |
| Prompts (P) | Mcps | 31.6 | 15.2 | 13.3 |
| 90% peak NEC | Mcps | 6.53 | 1.15 | 1.08 |
| Scatter fraction (S/(T+S)) | % | 30 | 45 | 47 |
| Randoms fraction (R/(T+R) | % | 42 | 58 | 61 |
IV. Conclusions
We find a synergistic increase of NEC with longer AFOV, suggesting gains in detectability and/or productivity for high-throughput clinical institutions. Thus, if tomograph cost increase in proportion with AFOV (or less), then AFOV is best chosen to match the AFOV requirements for the most common image studies used in high-throughput clinics. Detector thickness can be decreased for a longer-AFOV sparsely collimated tomograph while maintaining λNEC (increasing NEC in proportion with AFOV or better).
Acknowledgments
We thank Dr. Paul Kinahan at the University of Washington for his guidance and technical evaluation of this study. We also thank the Badawi Lab at the University of California, Davis, for technical discussions of their simulation work [5]. Finally, we thank the Center for Gamma-Ray Imaging and Dr. Harrison Barrett at the University of Arizona for use of their Beowulf cluster; This computational resource is funded by NIBIB with MERIT status under the grant number R37 EB000803.
This work was supported in part by PHS grants CA042593 and CA126593.
References
- 1.Perkins AE, Muehllehner G, Surti S, Karp JS. Performance measurements of a pixelated NaI(Tl) PET scanner. IEEE Trans Nucl Sci. 2003;50:373–377. [Google Scholar]
- 2.Jones WF, et al. First time measurement of transaxial resolution for a new high-sensitivity PET prototype using 5 LSO panel detectors. IEEE Nucl Sci Symp Conf Rec. 2002;2:694–698. [Google Scholar]
- 3.Watanabe M, et al. A High-Throughput Whole-Body PET Scanner Using Flat Panel PS-PMTs. IEEE Trans Nucl Sci. 2004;51(No 3):796–800. [Google Scholar]
- 4.Eriksson L, Townsend DW, Conti M, Melcher CL, Eriksson M, Jakoby BW, Rothfuss H, Casey ME, Bendriem B. Potentials for large axial field of view positron camera systems. IEEE Nuc Sci Symp Conf Rec. 2008:1632–1636. [Google Scholar]
- 5.Poon JK, MacDonald LR, Cherry SR, Badawi RD. A Simulation Study of a Long Axial Field of View Whole-Body PET Scanner using Cylindrical and Anthropomorphic Phantoms. IEEE Nuc Sci Symp Conf Rec. 2008:4999–5006. [Google Scholar]
- 6.Kinahan PE, Cheng P, Alessio AM, Lewellen TK. A Quantitative Approach to a Weight-Based Scanning Protocol for PET Oncology Imaging. IEEE Nucl Sci Symp Conf Rec. 2005;4:1886–1890. [Google Scholar]
- 7.http://depts.washington.edu/simset/html/simset_main.
- 8.Strother SC, et al. Measuring PET Scanner Sensitivity: Relating Countrates to Image Signal-to-Noise Ratios using Noise Equivalent Counts. IEEE Trans Nucl Sci. 1990;37(No 2):783–788. [Google Scholar]
- 9.Eriksson L, Wienhardt K, Dahlbom M. A Simple Data Loss Model for Positron Camera Systems. IEEE Trans Nucl Sci. 1994;41(No 4):1566–1570. [Google Scholar]


