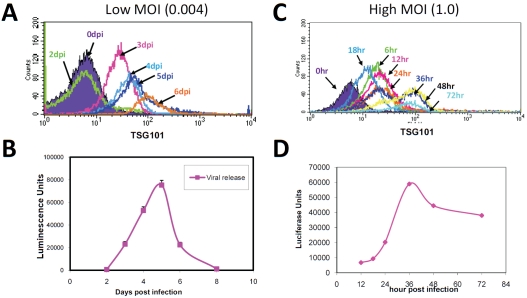
Figure 2.
TSG101 exposure on the surface of infected cells is consistent with release of progeny virus. MT-4 cells were infected with HIV-1NL4-3 for the length of time indicated at either low or high MOI as indicated and stained with pAb1299 (Panels A and C) and evaluated using flow cytometry. Virus release was quantified by luciferase expression of TZM-bl cells exposed to cell culture supernatant from each time point (Panels Band D).

