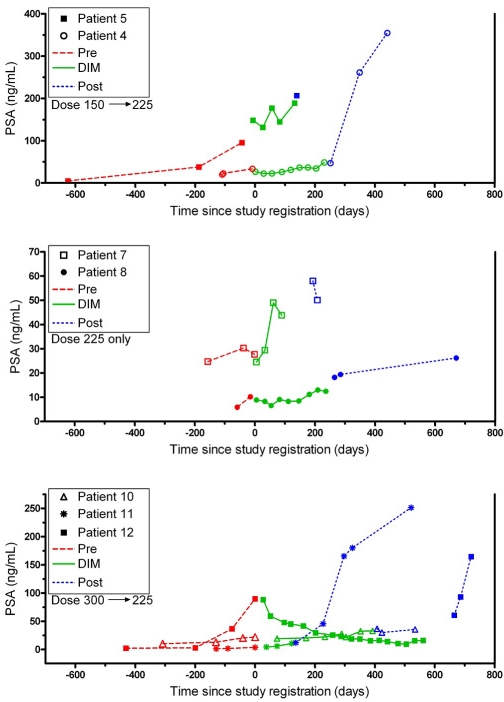
Figure 2.
PSA Response Curves for 7 patients. The actual PSA values are plotted overtime for each of the 7 patients who ended their BR-DIM treatment at the RP2D of 225 mg twice daily. The different line types identify three time periods: pre-, during, and post-therapy with BR-DIM. The upper graph is for the 2 patients (ID # 4, 5) who started at 150 mg twice daily; the middle graph is for the 2 patients (# 7, 8) who started at 225 mg twice daily; and the lower graph is for the 3 patients (# 10, 11, 12) who started at 300 mg twice daily. Patient ID numbers in Figure 2 match those in Table 3. To accommodate the high variability in PSA values while still providing adequate visibility in their lower range, and to keep PSA in its original units for easier visual interpretation, different scalings on each of the three Y-axes were utilized.

