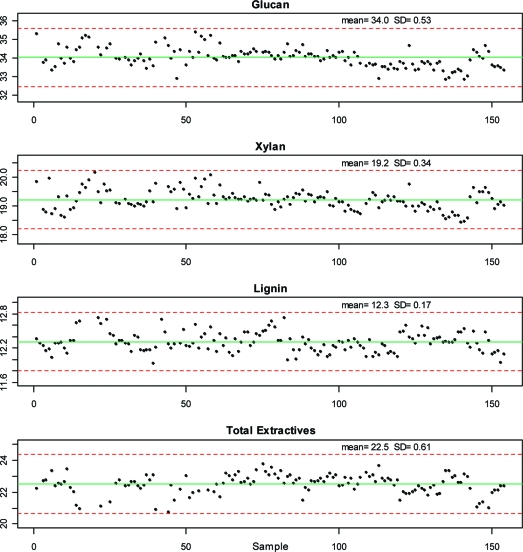
Figure 3.
Control chart plots of individual corn stover sample compositional analysis results from this study for glucan, xylan, lignin, and total extractives. These four constituents represent almost 90% of the total mass of the corn stover. Solid lines indicate the mean of each constituent. Dotted lines represent ±3 standard deviations from the mean.

