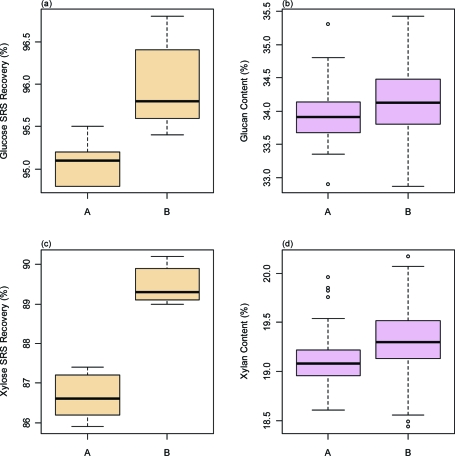
Figure 5.
Box plots of the sugar recovery standard (SRS) recoveries for (a) glucose and (c) xylose in the two laboratories (A and B) where the compositional analysis results were generated and the corresponding calculated (b) glucan and (d) xylan composition of the corn stover material. The thick lines show the average values, the boxes cover the interquartile range (IQR, “middle 50”), the whiskers denote the 1st and 4th quartile ranges, and any outliers are noted with circles. Statistically significant differences between the two laboratories were seen in SRS recoveries for both glucose and xylose. When these SRS recovery data were then used to correct the corresponding values for glucose and xylose in the corn stover samples, no statistically significant differences were seen between the two laboratories for either constituent.

