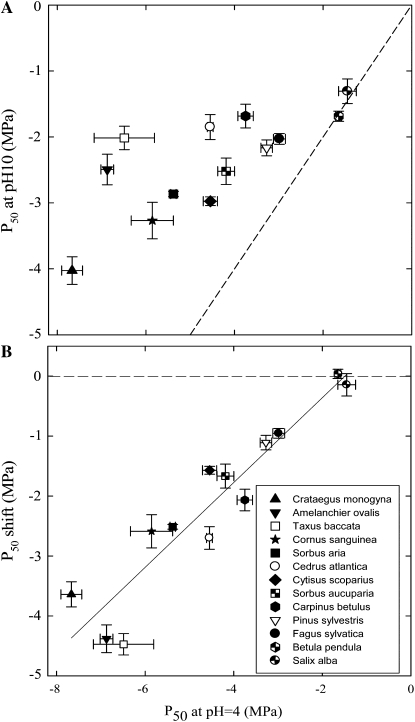
Figure 3.
Role of xylem calcium in vulnerability to cavitation in different woody species. For each species, stems were perfused with NaPO4 solutions at pH 4 or pH 10, and the P50 values were scored. Each dot represents the data for one angiosperm species (black symbols) or for one coniferophyte species (white symbols). The top section (A) shows P50 values at pH 4 versus P50 values at pH 10. The bottom section (B) shows the P50 values at pH 4 versus the shift in P50 values calculated as P50 pH4 − P50 pH10. Data are means (±se) of three to four samples. The solid line is a regression on the mean values, with r2 = 0.88 and P50 pH4 − P50 pH10 = 0.707 P50 pH4 + 1.055 (P < 0. 001). The dashed line is the function P50 pH4 = P50 pH10.

