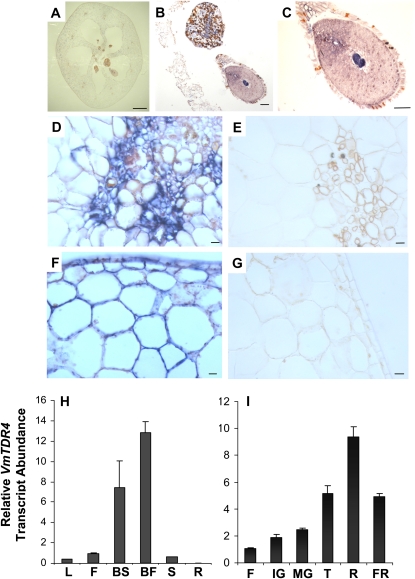
Figure 2.
In situ hybridization and expression profiles for VmTDR4 in bilberry. A to G, In situ hybridization. Bluish color indicates the expression of VmTDR4 in samples hybridized with the antisense probe. A, Cross section of whole bilberry fruit. B, Placenta and developing seed, antisense probe. C, Closeup of developing seed, antisense probe. D, Vascular tissue, antisense probe. E, Vascular tissue, sense probe. F, Epidermis and pericarp, antisense probe. G, Epidermis and pericarp, sense probe. Bars = 1 mm in A, 10 μm in B and C, and 1 μm in D to G. H and I, Determination of VmTDR4 transcript abundance by QRT-PCR. H, VmTDR4 transcript levels in bilberry leaf (L), flower (F), ripe berry skin (BS), ripe berry flesh (BF), mature seed (S), and rhizome (R). I, VmTDR4 transcript levels during bilberry fruit development and ripening in flowers (F), immature green (IG), mature green (MG), turning (T), ripe (R), and fully ripe (FR) fruits. Data are means ± se (n = 3).

