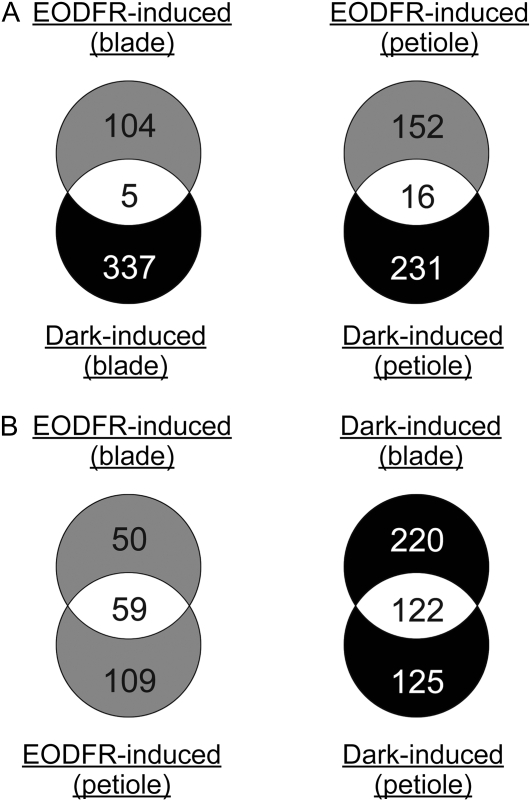
Figure 3.
Comparative analysis of EODFR- and dark-induced genes in leaf blades and petioles. A, Venn diagrams illustrating the different responses to the EODFR and dark treatments. B, Venn diagrams illustrating the different responses in leaf blades and petioles. The numbers of genes belonging to each category are shown.

