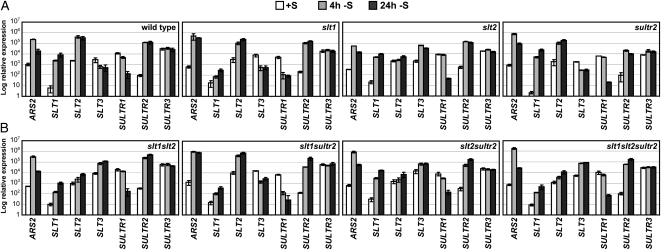
Figure 8.
RT-qPCR for analysis of transcript accumulation in wild-type and mutant strains. The accumulation of ARS2, SLT1, SLT2, SLT3, SULTR1, SULTR2, and SULTR3 transcripts is shown in wild-type cells and in the single (slt1, slt2, sultr2; A), double (slt1slt2, slt1sultr2, slt2sultr2), and triple (slt1slt2sultr2) mutants (B). RNA samples were collected prior to, and 4 and 24 h after, the cells were transferred from TAP to TAP−S medium. Levels of individual transcripts are given as relative abundance with respect to that of the housekeeping control gene (CBLP).

