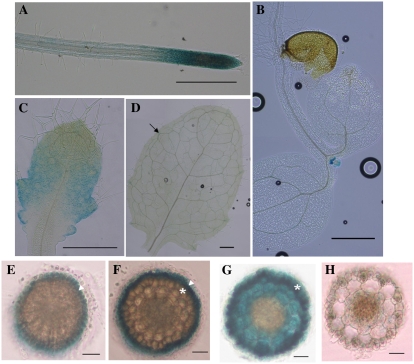
Figure 5.
GUS analysis of AtSTAR1 expression. T2 transgenic plants expressing pAtSTAR1:AtSTAR1-GUS were used for AtSTAR1 expression analysis. A to D, GUS activity in the roots (A), cotyledon and newly generated leaves (B), developing leaves (C), and old leaves (D). Arrow indicates GUS expression in hydathode of an elder leaf. Scale bars for A to D: 500 μm. E to H, Cellular localization of GUS expression in roots. E, Root cap. Triangle indicates the outer cell layers. F, Meristem region. Triangle indicates the lateral root caps and asterisk indicates the epidermal cells. G, Elongation zone. Asterisk indicates the epidermal cells. H, Mature zone. Scale bars for E to H: 30 μm.

