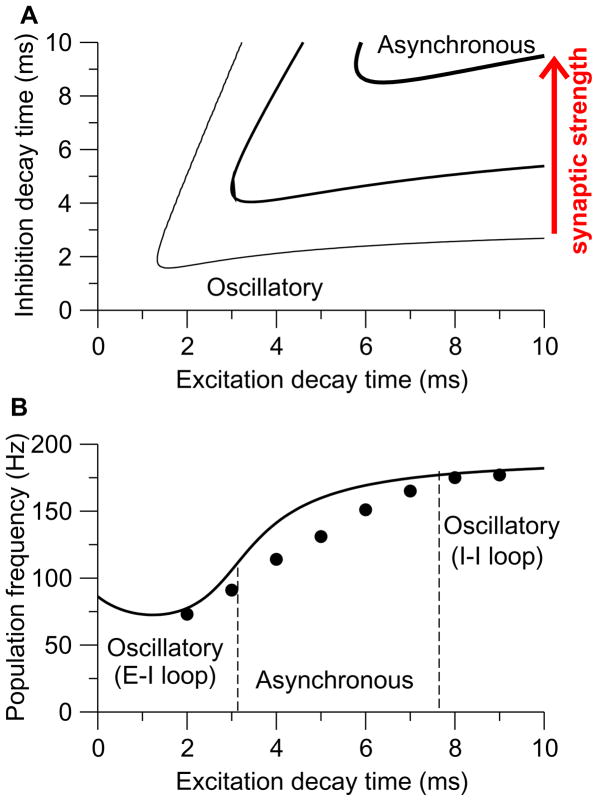
Figure 14. Dependence of sparsely synchronized oscillations on the strength and relative speeds of synaptic excitation and inhibition.
(A) Network dynamical behavior as a function of the excitatory (τE) and inhibitory (τI) synaptic time constants. A line separates the asynchronous state (upper right region) from the synchronous oscillation state (lower left region). This is shown with three levels of recurrent connection strength; coherent oscillations become more prevalent with stronger recurrence of the network. (B) population frequency as a function of the excitatory synaptic decay time constant τE, with fixed τI= 5 ms. Qualitatively, there are two kinds of instability from the asynchronous state to coherent oscillation. On one hand, when τE is much smaller than τI, the asynchronous dynamics is destabilized and oscillation develops through delayed inhibition in an excitatory-inhibitory loop scenario. On the other hand, when τE is sufficiently large, the excitatory drive is roughly tonic and the interneuronal network by itself generates synchronous oscillation. The oscillation frequency is much lower with shorter τE (gamma rhythm by the pyramid-interneuron loop mechanism) than with longer τE (ultrafast rhythm by the interneuronal network mechanism). Adapted with permission from [127].

