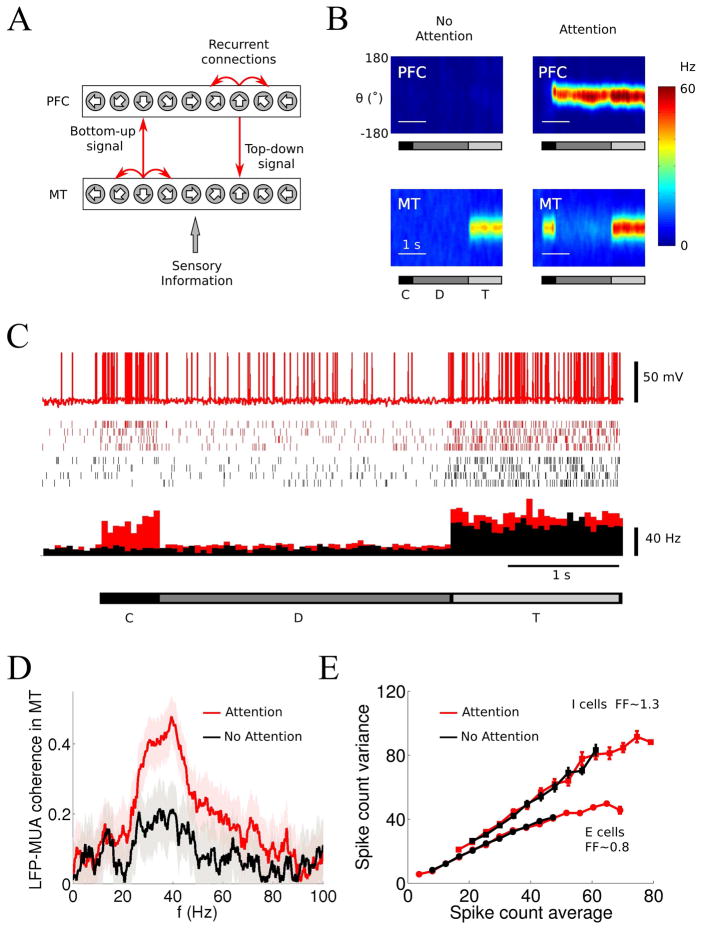
Figure 18. Synchronous field gamma oscillation with irregular neural firing in a spiking network model of selective attention.
(A) Schematic model architecture of a reciprocal loop between a sensory (MT) circuit and a working memory (PFC) circuit (‘source area’ for top-down attention signals). Each of the two circuits includes excitatory pyramidal neurons (E cells) and inhibitory interneurons (I cells), that are selective for a stimulus feature. Local connections within each circuit and cross-areal connections between excitatory cells depend on their respective preferred stimulus features. Top-down projection from the working memory circuit targets both excitatory and inhibitory cells in the sensory circuit. (B) Network activity for an unattended (left) and an attended trial (right). x-Axis, Time; y-axis, neurons labeled by preferred feature. Activity is color-coded. C, Cue period when an attentional cue is presented; D, delay period; T, test period when a sensory stimulus is presented. Note that in the attended trial (right), the attention cue triggers a self-sustained activity pattern in PFC, and enhanced sensory response in MT during tested period. Also note strip-like structure in the spatiotemporal activity pattern, indicating synchronous oscillations. (C) Activity of a neuron in response to a preferred stimulus. Top, Sample membrane potential; middle, spike trains in several trials; bottom, trial-averaged activity (red, attended; black, unattended trials). (D) Average coherence between the LFP and MUA in the sensory circuit increases in the gamma-frequency range for attention (red) relative to non-attention (black) trials during test stimulus presentation. (E) The variance versus mean of spike counts (Fano factor is given by the slope) for E cells and I cells in attended (red) and unattended (black) trials. (A–C) reproduced with permission from [30], (D–E) unpublished data taken from [31].

