
Figure 9. Propagating waves.
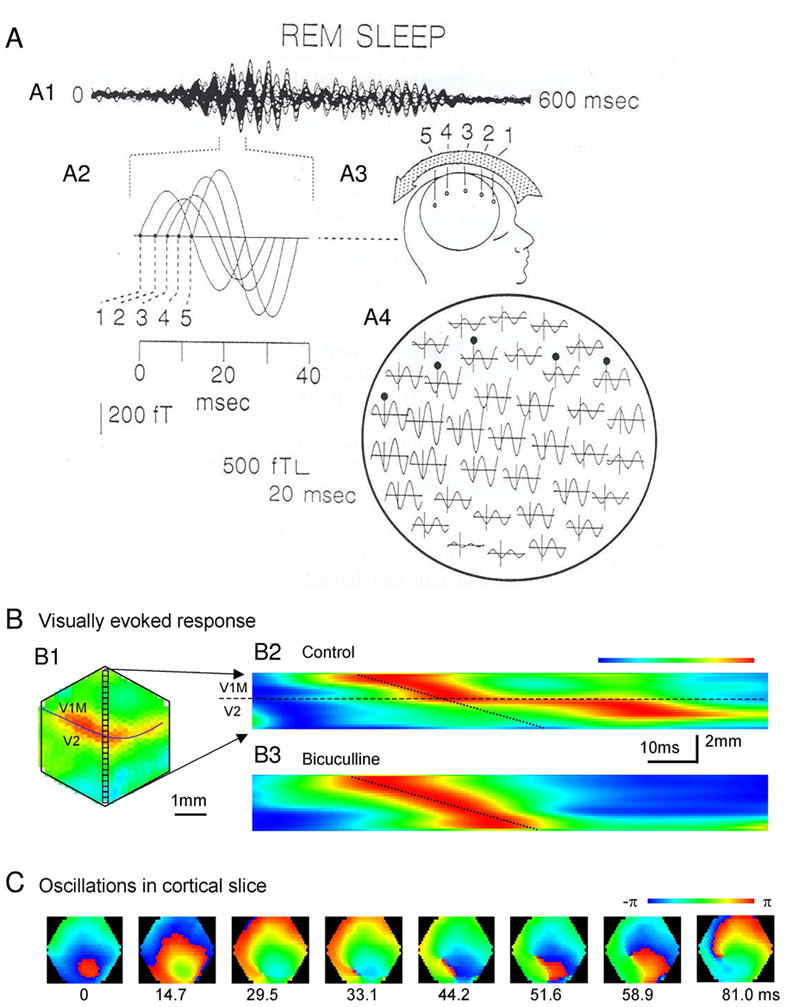
(A) Rostrocaudal phase shift of 40 Hz oscillation during rapid eye movement (REM) sleep as measured using MEG. (A1) shows synchronous activation in 37 channels during a 600 ms period. The oscillation in the left part of trace A1 has been expanded in trace A2 to show five different recording sites over the head. The five recording sites of trace (A2) are displayed in diagram (A3) for a single epoch, to illustrate the phase shift for the different 40 Hz waves during REM sleep. The direction of the phase shift is illustrated by an arrow above diagram (A3). The actual traces and their sites of recordings for a single epoch are shown in diagram (A4) for all 37 channels (ft: femtotesla). (B) Voltage-sensitive dye imaging of propagating waves in rat visual cortex in vivo. A rat visual cortex was imaged through a cranial window. (B1) A snapshot of visually evoked cortical activity propagating through the border of V1 and V2 areas. (B2) A spatial- temporal map made from one row of optical detectors (small boxes in B1) showing the time course of wave propagation. A visual stimulation to the eye evoked an activity in area V1 and propagated to V2. The map starts at 108 ms post stimulus. The propagating velocity in both V1 and V2 is about 100 mm/sec (the oblique broken line marks the velocity of 100 mm/sec). Propagating velocity is greatly reduced at the border between V1-V2 areas (marked by a horizontal broken line). (B3 ) When the cortical inhibition is slightly suppressed by GABAergic antagonist bicuculline, the slowing down at the V1/V2 border is completely eliminated. (C) Propagating waves during carbachol induced ~ 10 Hz oscillations in a brain slice cut from rat visual cortex (tangential section). Images are the phase map during the oscillation. From left: At the beginning of an oscillation cycle a propagating wave is started from a small region (red area at image of 0 ms) and propagating outward as a ring wave. The ring wave breaks and generates two phase singularities (at 33.1 ms). One of them further develops into a rotating spiral (after 58.9 ms). The spiral wave further sustains for ~ 1000 ms (~ 10 more rotations, images not shown). (A) Modified with permission from [598], (B) from [1079], (C) from [448].