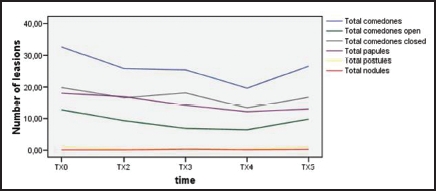
Figure 1.

Evolution of lesions during the TC treatment period.
- The number of lesions given is the mean number of lesions measured within the individual subjects during the eight-week treatment period
- Time is given as measure points during the visits: TX0 to TX5. During the phone call (24 hours after the start of the study), there was no measurement performed on the items presented in the graph
