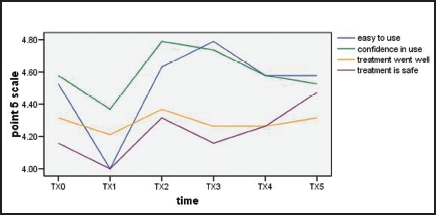
Figure 3.

Experience upon conducting treatment with TC.
- The value is given as a mean on a five-point scale, (1 = strongly disagree, 5 = strongly agree) for all the items given in the graph, except the amount of pain. See Figure 2 notes for how amount of pain was measured.
- Time is given as the measurement points at the visits
