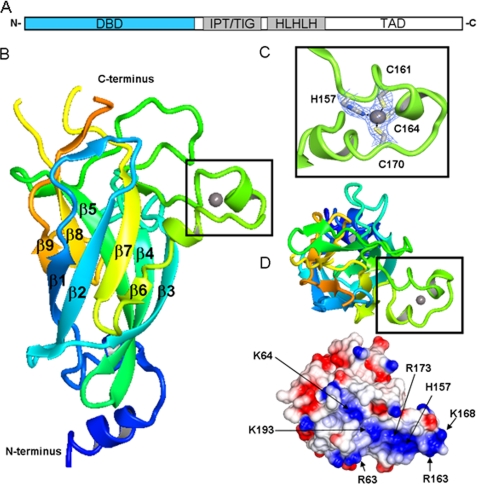
FIGURE 1.
Structural representation of EBF1 DBD. A, schematic illustration of EBF domain composition. DBD depicted in blue. B, schematic representation of the DNA binding domain. The N terminus is colored blue and blends through to the C terminus in orange. The zinc knuckle is represented in the black box. C, close-up of the residues involved in zinc coordination present in the zinc knuckle. D, top-down view of the postulated DNA binding region showing the zinc knuckle region and electrostatic potential surface. Amino acids contributing to potential DNA binding groove are indicated. TAD, transactivation domain.

