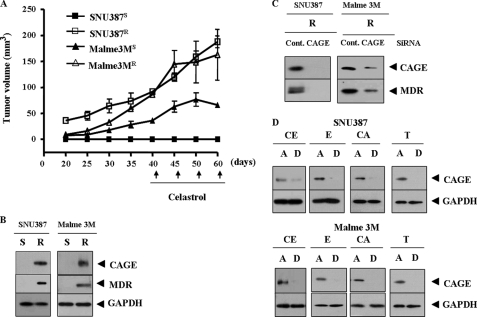
FIGURE 3.
Drug-resistant cancer cell lines show in vivo drug resistance and induction of CAGE. A, cancer cells were injected into athymic nude mice via tail vein. Celastrol (1 mg/kg) was injected into each nude mouse after the tumor reached a certain size. Tumor volume was measured as described under “Experimental Procedures.” Five mice were used for the injection of each cell line. Each value represents an average obtained from each mouse. B, Western blot analysis shows induction of CAGE and MDR in SNU387R and Malme3MR cells. S denotes drug-sensitive and R denotes drug-resistant. C, drug-resistant cancer cells were transiently transfected with control siRNA (10 nm) or CAGE siRNA (10 nm). At 48 h after transfection, cell lysates were prepared and subjected to Western blot analysis. D, SNU387 or Malme3M cells were treated with various anticancer drugs for 16 h (each at 1 μm). Cells were divided into attached (A) and detached (D) fraction. Cell lysates from each fraction were subjected to Western blot analysis. CE, celastrol; E, etoposide (DNA-damaging agent); CA, camptothecin (an inhibitor of topoisomerase); T, taxol; GAPDH, glyceraldehyde-3-phosphate dehydrogenase.

